
Use this splunk search to show Alert’s cron_schedule details: | rest /services/saved/searches splunk_server=local count=0 | search “cron_schedule”=”*/*” |table title,cron_schedule,author
Linux Deletion of SSL Certificate (mitre : T1485 , T1070.004 , T1070)
| tstats `summariesonly` count min(_time) as firstTime max(_time) as lastTime FROM datamodel=Endpoint.Filesystem where Filesystem.action=deleted Filesystem.file_path = “/etc/ssl/certs/*” Filesystem.file_path IN (“*.pem”, “*.crt”) by _time span=1h Filesystem.file_name Filesystem.file_path Filesystem.dest Filesystem.process_guid Filesystem.action | `drop_dm_object_name(Filesystem)` |rename process_guid as proc_guid |join proc_guid, _time [ | tstats `summariesonly` count FROM datamodel=Endpoint.Processes where Processes.parent_process_name != unknown by _time span=1h Processes.process_id Processes.process_name Processes.process Processes.dest Processes.parent_process_name Processes.parent_process Processes.process_path Processes.process_guid | `drop_dm_object_name(Processes)` |rename process_guid as proc_guid […]
port scan attack (by juniper)
index=* sourcetype=”juniper:firewall” src!=”192.168.*” | bin _time span=5m | stats dc(dest_port) as distinct_port by src,dest,_time |where distinct_port >1000
DLL Serach Oreder Hijacking (mitre : T1574.001)
index=* ((((EventCode=”4688″ OR EventCode=”1″) AND ((CommandLine=”*reg*” CommandLine=”*add*” CommandLine=”*/d*”) OR (CommandLine=”*Set-ItemProperty*” CommandLine=”*-value*”)) AND (CommandLine=”*00000000*” OR CommandLine=”*0*”) AND CommandLine=”*SafeDllSearchMode*”) OR ((EventCode=”4657″) ObjectValueName=”SafeDllSearchMode” value=”0″)) OR ((EventCode=”13″) EventType=”SetValue” TargetObject=”*SafeDllSearchMode” Details=”DWORD (0x00000000)”)) | fields EventCode,EventType,TargetObject,Details,CommandLine,ObjectValueName,value
Find where actual hostnames don’t match the host from the Universal Forwarder
Description: This will provide a list of hosts that don’t match the actual host names. This will allow you to find the hosts/IP addresses that need to have the clonefix actions ran against them This can probably be written better to account for host names that include an underscore in them. Requires access to _internal […]
1st time connection between servers (FTD CISCO)
Description: This query helps you to see all new connections between servers. Still work in progress and can be extended further. “White-listing” happens through the lookup files. Query: index=nfw “Allow” | rex (?:SrcIP.*\b(?<SrcIP>\d+\.\d+\.\d+\.\d+).*DstIP.*\b(?<DstIP>\d+\.\d+\.\d+\.\d+)) | stats count min(_time) AS earliest max(_time) AS maxtime BY SrcIP, DstIP | where earliest>relative_time(now(), “-1d@d”) AND count<=1 | search DstIP=10.0.0.0/8 AND […]
Show all successful splunk configuration changes by user
index=_audit action=edit* info=granted operation!=list host= object=* | transaction action user operation host maxspan=30s | stats values(action) as action values(object) as modified_object by _time,operation,user,host | rename user as modified_by | table _time action modified_object modified_by
Updated Netflow Activity dashboard
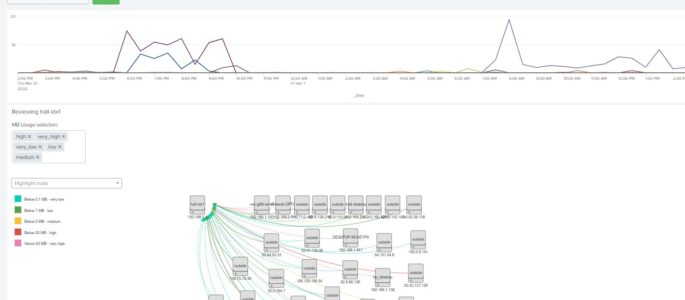
Description: I decided to revisit my Netflow Activity dashboard and make some much-needed improvements. While using this dashboard, I found that only half of the story was being presented by displaying download activity. With the changes I made during this video, this dashboard now allows me to see upload activity across the different devices in […]
Truncated Data Issues
Displays sourcetypes being truncated on ingest, then on selection, shows the related _internal message & the an event that caused it to trigger. <form> <label>Data Issues</label> <description>Truncation, Date Parsing and Timestamp issues</description> <fieldset submitButton=”false”> <input type=”time” token=”field1″> <label></label> <default> <earliest>-24h@h</earliest> <latest>now</latest> </default> </input> </fieldset> <row> <panel> <title>Choose a problematic sourcetype</title> <table> <search> <query>index=_internal sourcetype=splunkd component=LineBreakingProcessor […]
NIX Login Dashboard with Success, Failed and Sudo activity
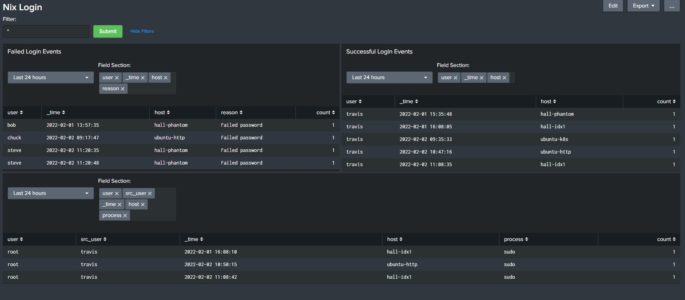
Description: Built this dashboard to display login activity for my *nix host devices. At the top you have a box called “Filter” that allows you to insert search parameters in the base search (ex: user=thall). Each panel has it’s own “TimeRangePicker” and a “Multiselect input” which allows you to decide what fields to add to […]
List the size of lookup files with an SPL search.
| rest splunk_server=local /services/data/lookup-table-files/ | rename eai:acl.app as app | table app title | search NOT title IN (*.kmz) | map maxsearches=990 search=”| inputlookup $title$ | eval size=0 | foreach * [ eval size=size+coalesce(len(‘<<FIELD>>’),0), app=\”$app$\”, title=$title$ | fields app title size]” | stats sum(size) by app title | sort – sum(size)
Detect Credit Card Numbers using Luhn Algorithm
Description Detect if any log file in Splunk contains Credit Card numbers. index=* ((source IN(“*.log”,”*.bak”,”*.txt”, “*.csv”,”/tmp*”,”/temp*”,”c:\tmp*”)) OR (tag=web dest_content=*)) | eval comment=”Match against the simple CC regex to narrow down the events in the lookup” | rex max_match=1 “[\”\s\’\,]{0,1}(?<CCMatch>[\d.\-\s]{11,24})[\”\s\’\,]{0,1}” | where isnotnull(CCMatch) | eval comment=”Apply the LUHN algorithm to see if the CC number […]
Indexes size and EPS
Description: SPL request to display by index : Index name Index size Events sum, min, avg, max, perc95 Events sum, min, avg, max, perc95 to work hours (8am-6pm) Required: Splunk license Query: index=_internal source=*license_usage.log idx=z* | fields b idx _time| eval GB=b/1024/1024/1024, index=idx | stats sum(GB) as “Volume GB” by index | append extendtimerange=t […]
Software inventory
I’ve been looking a while for something like this, and decided to make it myself. This relies on the tinv_software _inventory add-on found on Splunkbase, but you can do it without, if you feel like it. <form> <label>Software Inventory</label> <fieldset submitButton=”false” autoRun=”false”> <input type=”dropdown” token=”software_picker” searchWhenChanged=”true”> <label>Software</label> <choice value=”"falcon-sensor" "Crowdstrike Windows Sensor"”>Crowdstrike</choice> <choice value=”"*qualys*"”>Qualys</choice> <choice […]
DNS search for encoded data
Description: Use this Splunk search to find Base64 encoded content in DNS queries. The goal is to examine the DNS query field of the dns events to find subdomain streams that contain only Base64 valid characters. Utilizing DNS queries with encoded information is a known method to exfiltrate data. But you do not know if […]
Show cron frequency and scheduling of all scheduled searches
This search shows you all scheduled searches and their respective cron frequency and cron schedule. This also helps finding frequently running saved searches. | rest splunk_server=local “/servicesNS/-/-/saved/searches/” search=”is_scheduled=1″ search=”disabled=0″ | fields title, cron_schedule, eai:acl.app | rename title as savedsearch_name | eval pieces=split(cron_schedule, ” “) | eval c_min=mvindex(pieces, 0), c_h=mvindex(pieces, 1), c_d=mvindex(pieces, 2), c_mday=mvindex(pieces, 3), c_wday=mvindex(pieces, […]
Data model Acceleration Details
This Splunk Search shows you a lot of good information about your data model acceleration and performance. | rest /services/admin/summarization by_tstats=t splunk_server=local count=0 | eval key=replace(title,((“tstats:DM_” . ‘eai:acl.app’) . “_”),””), datamodel=replace(‘summary.id’,((“DM_” . ‘eai:acl.app’) . “_”),””) | join type=left key [| rest /services/data/models splunk_server=local count=0 | table title, “acceleration.cron_schedule”, “eai:digest” | rename title as key | […]
Splunk CIM Assist
Got tired of having to go through each data source to determine what indexes should go into the Splunk_SA_CIM search macros, this does the leg work. index=* | fields index, tag, user, action, object_category | eval datamodel = if(tag=”alert”, index.”.”.”alert”, datamodel) | eval datamodel = if(tag=”listening” AND tag=”port”, index.”.”.”application_state_deprecated”.”.”.”endpoint”, datamodel) | eval datamodel = if(tag=”process” […]
Search for disabled AD accounts that have been re-enabled
This is a search you can use as an alert or whatever you desire to look for AD accounts that have been disabled in the past 90 days then re-enabled in the past 24h. You can tweak as needed. index=YOURINDEX EventCode IN (4725,4722) earliest=-90d | eval account=mvindex(Account_Name,1) “`separate out the account from the logs and […]
Query for when PowerShell execution policy is set to Bypass
index=”windows” sourcetype=WinRegistry key_path=”HKLM\\software\\microsoft\\powershell\\1\\shellids\\microsoft.powershell\\executionpolicy” | table _time, host, registry_type, registry_value_data, registry_value_name | rename host as Host, registry_type as Action, registry_value_data as “Registry Value”, registry_value_name as “Registry Value Name”
