
Description:
I decided to revisit my Netflow Activity dashboard and make some much-needed improvements. While using this dashboard, I found that only half of the story was being presented by displaying download activity. With the changes I made during this video, this dashboard now allows me to see upload activity across the different devices in my network.
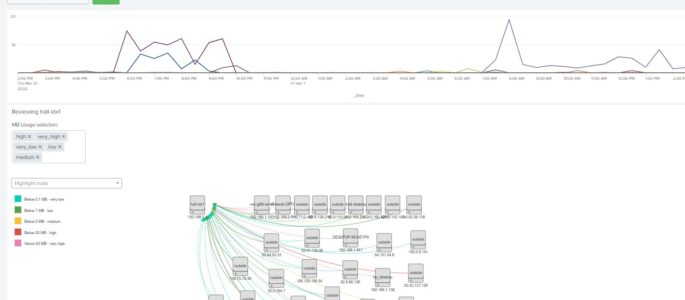
The Netflow Activity dashboard helps me understand activity in my home lab by analyzing netflow data from my OPNsense firewall. This dashboard begins with a simple timechart that shows a trend of average mb_in across all of my devices. I have OPNsense configured to send Netflow v9 data to a Splunk independent stream forwarder, which then sends it to my Splunk indexer.
This dashboard utilizes the Network Topology – Custom Visualization and the Network Toolkit to make it more interactive and enable WHOIS actions on source IP addresses. You will need to have both of these apps installed for the dashboard to function as intended.
Additionally, you will need to adjust the base search of this dashboard to match the index where the netflow data resides. Since this dashboard uses post-processing, you will also need to edit the provided source XML.
Here is a video that provides an overview of the dashboard and how to adjust the source XML:
https://youtu.be/TsRmLhLenHU
Add-on’s required:
Network Topology – Custom Visualization: https://splunkbase.splunk.com/app/3762/
Network Toolkit: https://splunkbase.splunk.com/app/3491/
Dashboard:
<form version="1.1" theme="light"> <label>Netflow Activity view - ver 2.1</label> <search id="net_base1"> <query>index=netflow_opnsense | stats count by _time bytes_in src_ip src_port dest_ip dest_port tcp_flags tos nexthop_addr | lookup hall_dhcp_leases.csv ip as src_ip OUTPUT hostname as src_host | lookup hall_dhcp_leases.csv ip as dest_ip OUTPUT hostname as dest_host </query> <earliest>$time1.earliest$</earliest> <latest>$time1.latest$</latest> <sampleRatio>1</sampleRatio> </search> <fieldset submitButton="true" autoRun="false"> <input type="time" token="time1"> <label></label> <default> <earliest>-24h@h</earliest> <latest>now</latest> </default> </input> </fieldset> <row> <panel> <title>MB downloaded per Host</title> <chart> <search base="net_base1"> <query>| search dest_ip=192.168.0.0/16 NOT src_ip=192.168.0.0/16 | eval mb_in=(bytes_in/1024/1024) | timechart sum(mb_in) by dest_host useother=f usenull=f span=1m limit=30</query> </search> <option name="charting.axisLabelsX.majorLabelStyle.overflowMode">ellipsisNone</option> <option name="charting.axisLabelsX.majorLabelStyle.rotation">0</option> <option name="charting.axisTitleX.visibility">visible</option> <option name="charting.axisTitleY.visibility">visible</option> <option name="charting.axisTitleY2.visibility">visible</option> <option name="charting.axisX.abbreviation">none</option> <option name="charting.axisX.scale">linear</option> <option name="charting.axisY.abbreviation">none</option> <option name="charting.axisY.scale">linear</option> <option name="charting.axisY2.abbreviation">none</option> <option name="charting.axisY2.enabled">0</option> <option name="charting.axisY2.scale">inherit</option> <option name="charting.chart">line</option> <option name="charting.chart.bubbleMaximumSize">50</option> <option name="charting.chart.bubbleMinimumSize">10</option> <option name="charting.chart.bubbleSizeBy">area</option> <option name="charting.chart.nullValueMode">zero</option> <option name="charting.chart.showDataLabels">none</option> <option name="charting.chart.sliceCollapsingThreshold">0.01</option> <option name="charting.chart.stackMode">default</option> <option name="charting.chart.style">shiny</option> <option name="charting.drilldown">all</option> <option name="charting.layout.splitSeries">0</option> <option name="charting.layout.splitSeries.allowIndependentYRanges">0</option> <option name="charting.legend.labelStyle.overflowMode">ellipsisMiddle</option> <option name="charting.legend.mode">standard</option> <option name="charting.legend.placement">right</option> <option name="charting.lineWidth">2</option> <option name="refresh.display">progressbar</option> <option name="trellis.enabled">0</option> <option name="trellis.scales.shared">1</option> <option name="trellis.size">medium</option> <drilldown> <set token="hostname">$click.name2$</set> <set token="dir">dest_host</set> <set token="range">dest_ip=192.168.0.0/16 NOT src_ip=192.168.0.0/16</set> </drilldown> </chart> </panel> </row> <row> <panel> <title>MB uploaded per Host</title> <chart> <search base="net_base1"> <query>| search src_ip=192.168.0.0/16 NOT dest_ip=192.168.0.0/16 | eval mb_in=(bytes_in/1024/1024) | timechart sum(mb_in) by src_host useother=f usenull=f span=1m limit=30</query> </search> <option name="charting.axisLabelsX.majorLabelStyle.overflowMode">ellipsisNone</option> <option name="charting.axisLabelsX.majorLabelStyle.rotation">0</option> <option name="charting.axisTitleX.visibility">visible</option> <option name="charting.axisTitleY.visibility">visible</option> <option name="charting.axisTitleY2.visibility">visible</option> <option name="charting.axisX.abbreviation">none</option> <option name="charting.axisX.scale">linear</option> <option name="charting.axisY.abbreviation">none</option> <option name="charting.axisY.scale">linear</option> <option name="charting.axisY2.abbreviation">none</option> <option name="charting.axisY2.enabled">0</option> <option name="charting.axisY2.scale">inherit</option> <option name="charting.chart">line</option> <option name="charting.chart.bubbleMaximumSize">50</option> <option name="charting.chart.bubbleMinimumSize">10</option> <option name="charting.chart.bubbleSizeBy">area</option> <option name="charting.chart.nullValueMode">zero</option> <option name="charting.chart.showDataLabels">none</option> <option name="charting.chart.sliceCollapsingThreshold">0.01</option> <option name="charting.chart.stackMode">default</option> <option name="charting.chart.style">shiny</option> <option name="charting.drilldown">all</option> <option name="charting.layout.splitSeries">0</option> <option name="charting.layout.splitSeries.allowIndependentYRanges">0</option> <option name="charting.legend.labelStyle.overflowMode">ellipsisMiddle</option> <option name="charting.legend.mode">standard</option> <option name="charting.legend.placement">right</option> <option name="charting.lineWidth">2</option> <option name="refresh.display">progressbar</option> <option name="trellis.enabled">0</option> <option name="trellis.scales.shared">1</option> <option name="trellis.size">medium</option> <drilldown> <set token="hostname">$click.name2$</set> <set token="dir">src_host</set> <set token="range">src_ip=192.168.0.0/16 NOT dest_ip=192.168.0.0/16</set> </drilldown> </chart> </panel> </row> <row> <panel> <title>Reviewing $dir$ = $hostname$ and $range$</title> <input type="multiselect" token="field1" searchWhenChanged="true"> <label>MB Usage selection:</label> <choice value="very_low">very_low</choice> <choice value="low">low</choice> <choice value="medium">medium</choice> <choice value="high">high</choice> <choice value="very_high">very_high</choice> <default>very_low,low,medium,high,very_high</default> <prefix>search usage IN(</prefix> <suffix>)</suffix> <delimiter> </delimiter> </input> <viz type="network_topology.network_topology"> <search base="net_base1"> <query>| search $dir$="$hostname$" $range$ | fillnull value=outside src_host dest_host | eval mb_in=(bytes_in/1024/1024) | stats sum(mb_in) as mb_in by src_ip src_host dest_ip dest_host | eval usage=case(mb_in<.1,"very_low",mb_in<1,"low",mb_in<5,"medium",mb_in<20,"high",mb_in>20,"very_high") | $field1$ | table src_ip src_host dest_ip dest_host usage</query> </search> <option name="drilldown">none</option> <option name="network_topology.network_topology.drilldown">false</option> <option name="network_topology.network_topology.link1">very_low</option> <option name="network_topology.network_topology.link1Color">#00d1b1</option> <option name="network_topology.network_topology.link1Dashed">true</option> <option name="network_topology.network_topology.link1Label">Below 0.1 MB - very low</option> <option name="network_topology.network_topology.link2">low</option> <option name="network_topology.network_topology.link2Color">#53a051</option> <option name="network_topology.network_topology.link2Dashed">false</option> <option name="network_topology.network_topology.link2Label">Below 1 MB - low</option> <option name="network_topology.network_topology.link3">medium</option> <option name="network_topology.network_topology.link3Color">#f8be34</option> <option name="network_topology.network_topology.link3Dashed">true</option> <option name="network_topology.network_topology.link3Label">Below 5 MB - medium</option> <option name="network_topology.network_topology.link4">high</option> <option name="network_topology.network_topology.link4Color">#dc4e41</option> <option name="network_topology.network_topology.link4Dashed">false</option> <option name="network_topology.network_topology.link4Label">Below 20 MB - high</option> <option name="network_topology.network_topology.link5">very_high</option> <option name="network_topology.network_topology.link5Color">#ed7db1</option> <option name="network_topology.network_topology.link5Dashed">true</option> <option name="network_topology.network_topology.link5Label">Above 20 MB - very high</option> <option name="network_topology.network_topology.unfocusOpacity">0</option> <option name="refresh.display">progressbar</option> </viz> </panel> </row> <row> <panel> <input type="multiselect" token="field2" searchWhenChanged="true"> <label>Field selection:</label> <default>src_host,dest_ip,dest_host</default> <delimiter> </delimiter> <choice value="src_host">src_host</choice> <choice value="src_port">src_port</choice> <choice value="dest_host">dest_host</choice> <choice value="dest_ip">dest_ip</choice> <choice value="dest_port">dest_port</choice> <choice value="tcp_flags">tcp_flags</choice> <choice value="tos">tos</choice> <choice value="nexthop_addr">nexthop_addr</choice> </input> <table> <search base="net_base1"> <query>| search $dir$="$hostname$" | eval mb_in=((bytes_in/1024)/1024) | fillnull value=outside src_host dest_host | stats sum(mb_in) as mb_in by src_ip $field2$ | eval usage=case(mb_in<.1,"very_low",mb_in<1,"low",mb_in<5,"medium",mb_in<20,"high",mb_in>20,"very_high") | $field1$ | sort -mb_in</query> </search> <option name="drilldown">cell</option> <drilldown> <set token="ip">$click.value2$</set> </drilldown> </table> </panel> <panel> <title>WHOIS: $ip$</title> <table> <search> <query>| whois $ip$</query> <earliest>$time1.earliest$</earliest> <latest>$time1.latest$</latest> </search> <option name="drilldown">none</option> <option name="refresh.display">progressbar</option> </table> </panel> </row> </form>
