
Here’s an incredibly simple Splunk query to count the number of characters in an event: index=* | eval CharCount=len(_raw)
Dashboard for Splunk Infrastructure/Server Specs at a Glance
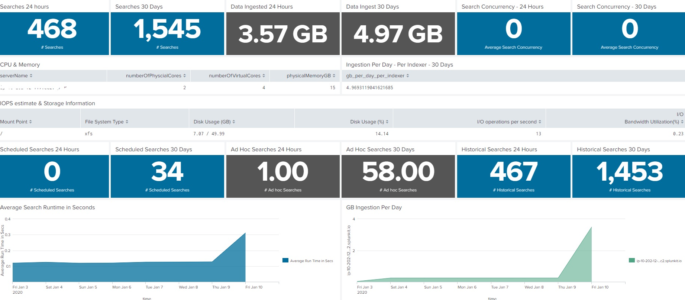
This dashboard will show the server or infrastructure specs of your Splunk environment. This is not intended to replace the Monitoring console, but rather augment as sometimes we need a condensed version of what is going on inside our Splunk environment. I’ve had fun with it on my homelab, so if you find something not […]
Apps Deployed from Deployment Server
Want to show what apps have been deployed to forwarders from a deployment server (DS)? Try this Splunk Search: index=_internal sourcetype=splunkd component=DeployedApplication installing | stats count latest(_time) AS latest_time by host app | convert ctime(latest_time)
List of Forwarders that are Deployment Clients
Need a list of Forwarders that are talking to a Deployment Server? Try this: index=_internal sourcetype=splunkd component=DC* Handshake | stats count by host Additional REST query (performed on the DS) will return desired results (Thanks to Lyx for pointing this out!): | rest /services/deployment/server/clients splunk_server=local | table hostname applications.*.serverclasses | untable hostname, applications, serverclass | […]
Host not sending logs for x days
This Splunk Query will show hosts that stopped sending logs for at least 48 hours. You’ll want to change the time range to be relevant to your environment, and you may need to tweak the 48 hour range to something that is more appropriate for your environment. | tstats count as countAtToday latest(_time) as lastTime […]
Use TSTATS to find hosts no longer sending data
This is a simple tstats query shows all hosts and sourcetypes that have reported data, and shows the time in seconds since anything was sent. Be sure to run the query over a lengthy period of time in order to include machines that haven’t sent data for sometime. Don’t worry about the search-time so much, […]
Get Sourcetype and Index Info via TSTATS
Use the following simple tstats query to return the latest time events came in for a given index as well as list all sourcetypes for each index: |tstats values(sourcetype) as Sourcetype latest(_time) as Time groupby index | convert ctime(Time)
Universal Forwarder Throughput Limit Hit Count
This search counts the amount of times the UF’s throughput limit is hit. I also threw in a sparkline: index=_internal sourcetype=splunkd “current data throughput” | rex “Current data throughput \((?<kb>\S+)” | eval rate=case(kb < 500, “256”, kb > 499 AND kb < 520, “512”, kb > 520 AND kb < 770 ,”768″, kb>771 AND kb<1210, […]
List All Hosts Associated with All Indexes
Using the Splunk Tstats command you can quickly list all hosts associated with all indexes: |tstats values(host) where index=* by index
Hosts Taking a Long Time to Scan – Qualys
The following Splunk query will show the hosts taking an abnormally lengthy time to scan (helps find that needle in a haystack) within the Qualys Sourcetype: sourcetype=”qualys:hostDetection” eventtype=qualys_host_summary_event SCAN_DURATION> 1800 | sort -SCAN_DURATION | table IP, DNS, OS, SCAN_DURATION I take no credit for this. These queries were discovered on Tarun Kumar’s blog.
Splunk Objects With Permissions Granted to Non-existent Roles
Useful search to show a bit of detail on roles and user permissions. | rest /servicesNS/-/-/admin/directory count=0 splunk_server=local | fields eai:acl.app, eai:acl.owner, eai:acl.perms.*, eai:acl.sharing, eai:location, title | eval perms=mvappend(‘eai:acl.perms.read’,’eai:acl.perms.write’) | fields – eai:acl.perms.* | mvexpand perms | where perms!=”*” AND NOT [ | rest /servicesNS/-/-/authorization/roles count=0 splunk_server=local | fields title | rename title as perms […]
Every index explicitly granted to a role
Self explanatory, maps roles to indexes. Useful if you have a lot of indexes! | rest /servicesNS/-/-/authorization/roles count=0 splunk_server=local | fields title,srchIndexesAllowed | rename srchIndexesAllowed as index title as role | mvexpand index | where NOT match(index,”.*\*.*”) I found this at: https://gist.github.com/acharlieh/3254a7ab13297c760376 Credit goes to acharlieh!
Average Splunk Web requests by hour
This query is pretty awesome! It helped enlighten us to exactly when our splunk infrastructure is being hit with users index=_internal sourcetype=splunk_web_access [ rest / splunk_server=local | fields splunk_server | rename splunk_server as host ] | bin _time span=1d | stats count by date_hour _time | appendpipe [ fields _time | dedup _time | eval […]
All indexes not explicitly granted to a role
| rest /servicesNS/-/-/data/indexes count=0 | stats max(isInternal) as internal, max(disabled) as disabled, max(isReadOnly) as readonly by title | fillnull | where internal=0 AND disabled=0 AND readonly=0 | fields title | rename title as index | join index type=left [ rest /servicesNS/-/-/authorization/roles count=0 splunk_server=local | fields title,srchIndexesAllowed | rename srchIndexesAllowed as index title as role | […]
Forwarder Diagnostics – Last time Data Was Received by Index and Sourcetype
The following Splunk query was modified from the Splunk Health Overview app on Splunkbase. This particular Splunk search returns a list of hosts with their indexes and sourcetypes and determines when each last sent data. This query can help diagnose which Splunk Universal Forwarders may be having issues sending data, or simply stopped sending a […]
Count of Host added to Splunk by Month
Can we get a Splunk Query that list of hosts added to Splunk in a month. Like Month 1 : 200 devices added Month 2: 400 devices added You would do this: host=* | stats dc(host) as host by date_month (Edits Made and query provided by the GoSplunk Ninja)
Detailed list of Errors Per Host
The following Splunk search will return a detailed list (by message) of errors associated with hosts running a universal forwarder: index=_internal sourcetype=”splunkd” log_level=”ERROR” | stats sparkline count dc(host) as uniqhosts last(message) as message last(_time) as last first(_time) as first by punct | convert ctime(last) ctime(first) | table message count uniqhosts sparkline first last | sort […]
Memory Usage and Information on Splunk Server
This Splunk Search Query will perform a rest call to indicate current memory consumption on the Splunk server(s) itself/themselves: *NOTE* The following has been modified from the “Distributed Management Console” to be more generic for a copy, paste, and search example. | rest splunk_server=* /services/server/status/resource-usage/hostwide | stats first(normalized_load_avg_1min) as load_average first(cpu_system_pct) as system, first(cpu_user_pct) as […]
Timestamp vs Indextime of Events (Diagnostic Query)
This query has in the past help me track down issues between forwarders and indexers, and even on occasion finding some time sync issues. Feel free to tweak, modify, and improve upon this query as I’m not 100% certain the math will work in your favor outside of highlighting (positive or negative) time differences! index=* […]
Last Time a Forwarder Checked In
The following Splunk Search Query will return results based on the last time a forwarder (universal forwarder, heavy forwarder, or otherwise) checked in. The query is a modified version of a query that was packaged with the Deployment Monitor app. index=”_internal” source=”*metrics.lo*” group=tcpin_connections NOT eventType=* | eval sourceHost=if(isnull(hostname), sourceHost,hostname) | eval connectionType=case(fwdType==”uf”,”universal forwarder”, fwdType==”lwf”, “lightweight […]
