
index=<your JSON index> | spath input=<your field w/ nested JSON data> path={} | mvexpand {} | spath input={}
Identify all saved searches that use a specific keyword
Description: This Splunk search searches all your saved searches for a specific keyword. Handy if you need to identify all searches that use a specific index, sourcetype or other keyword. Query: |rest /servicesNS/-/-/saved/searches add_orphan_field=yes count=0 | rename eai:acl.app AS app | rename eai:acl.app AS app | search qualifiedSearch=*keyword* | table title, cron_schedule, author, app, […]
Alert when ESCU updates detections
This query can set up an alert for when ESCU updates a detection, compared to the version you are using from clone. This requires ESCU v4.31.0 with the new metadata information being used. | rest splunk_server=local count=0 /servicesNS/-/-/saved/searches | search action.notable.param.rule_title=* action.correlationsearch.metadata=* disabled=0 | rex field=action.correlationsearch.metadata “\”detection_id\”: \”(?P<detection_id>.{8}-.{4}-.{4}-.{4}-.{12})” | rex field=action.correlationsearch.metadata “\”detection_version\”: \”(?P<detection_version>.+)\”” | […]
Find duplicate events
index=<specify index> | eval x=sha256(_raw) | stats count values(host) values(source) values(sourcetype) values(index) by x | where count>1
ESCU Update Tracking
Description: Splunk Threat Research team (STRT) does a good job at keeping up with new analytics. However, for smaller deployments it can be difficult to sort through what is applicable and/or what has changed when these new versions are available. They have a solution for a larger organization to be able to track and test […]
Dashboard: Splunk Insights – Users & Roles
Quick glance into who’s who in the zoo for users, capabilities, roles, and what indexes are searchable. Also calls out users with can_delete capabilities. Mileage may vary, please comment if there are any issues! <dashboard version=”1.1″> <label>Splunk Insights – Users and Roles</label> <row> <panel> <title>Number of Roles</title> <single> <title>Click to Expand</title> <search> <query>| rest splunk_server=local […]
exploremydata – data explorer
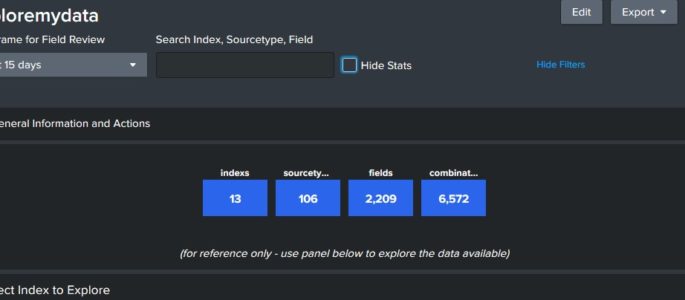
This dashboard provides and overview of the data that is available to query. Click on the index below to review source types in that index, and then a sourcetype to review fields. Finally, you can click on a field to see sample values in that field. Click “Show Filters” above to open a search window […]
Sourcetype missing in Datamodels
| tstats count WHERE index=* NOT index IN(sum_*, *summary, cim_*, es_*,splunkd* splunk_*) by sourcetype | fields – count | append [| datamodel | rex field=_raw “\”modelName\”\s*\:\s*\”(?<modelName>[^\”]+)\”” | fields modelName | table modelName | map maxsearches=40 search=”tstats summariesonly=true count from datamodel=$modelName$ by sourcetype |eval modelName=\”$modelName$\”” ] | fillnull value=”placeholder” modelName | table modelName sourcetype count | […]
Splunk License Consumption via _introspection
Just sharing a query I found useful lately when licensing dashboards are being silly. Mileage may vary. index=”_introspection” component=”licensing.stack”| bucket _time span=1d | stats latest(“data.consumption”) as dataConsumption latest(“data.pools{}.quota”) as poolQuota by _time| eval pctUsed=(dataConsumption/poolQuota * 100)| timechart span=1d max(pctUsed)
check expected splunk version with reality
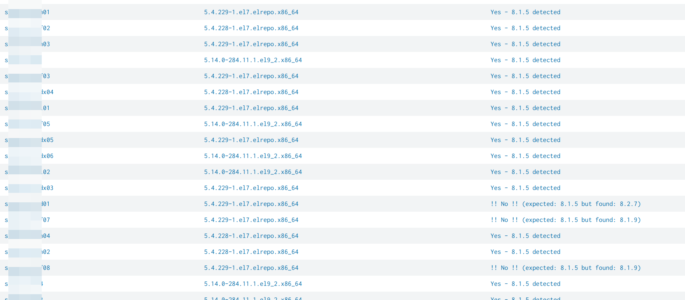
simply query to compare an expected splunk version with reality. simply adjust “expected_version” to your expected version: | rest splunk_server=* /services/server/status/resource-usage/hostwide | table splunk_server splunk_version| eval expected_version=”8.1.5″| eval match_expectation=if(splunk_version == expected_version, “Yes – ” . expected_version . ” detected”, “!! No !! (expected: ” . expected_version . ” but found: ” . splunk_version . “)”)| […]
Get Fields Defined for Multiple KVStore Collections
Description: This query gets all collection titles in your instance, then runs a map function on them to get their fields from a single query. The reason this is necessary is because the API returns collection fields as columns, not values, and if you just table all fields for multiple collections, you’ll end up with […]
Original posted in 2015 Testing an issue with brackets
The following search was copied from 2015: index=_internal earliest=-48h latest=-24h | bin _time span=10m | stats count by _time | eval window=”yesterday” | append [ | timechart span=10m sum(count) by window]
Dashboard sourcetype validation
Wanted a dashboard supporting checks on a sourcetype to see at the same time: how data where ingested, where and get an overview of samples and fields summary what is the stanza configuration (following the 9-step sequence) this dashboard uses internal rest API (| rest) before running dashboard a lookup table (CSV) and a lookup […]
Current vulnerabilities from tenable.io
Want to view the Tenable Current Vulnerabilities? But you have tenable.io? Then this is for you: index=* sourcetype=”tenable:io:vuln” severity!=informational | chart count over severity by ip
Correlation Search Audit Search
Use this search to audit your correlation searches. It includes various information like who is the author of the correlation search, who modified it, etc. In addition to that, the search also gives you an brief info on whether the correlation search has been triggered in past 30 days or not considering it has notable […]
NIX Debian Package (dpkg.log) Dashboard
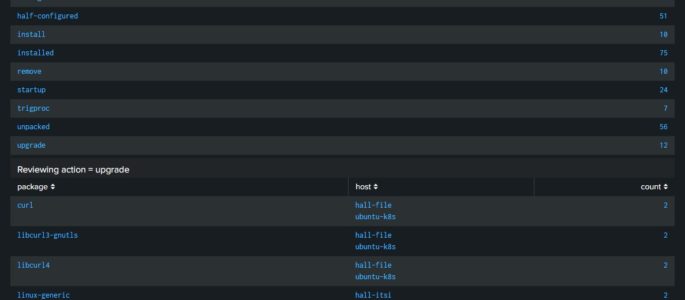
Description: Wanted a dashboard that would provide information around package information across my Ubuntu servers. At this time I have only built this dashboard to review the “dpkg.log”. In an attempt to help people understand how I build dashboard, posted a video on YouTube where you can follow along while I build this dashboard out: […]
Dashboard to measure Indexes and Sourcetypes, based upon first and last date of events
This dashboard will use REST API endpoints to grab a list of all indexes and then map out by sourcetype how many events when the first one was (based upon _time) and the last. Then does basic date math to show how long of a period that is as retention (though it does not show […]
Query to see incidents logged by correlation search in ES incident review dashboard
Query to see incidents logged by correlation search in ES incident review dashboard | `incident_review` |search rule_name=”<correlation_search_name>”
REST Call for a list of Alert actions (Webhook_sms or Email or notable or ..)
Use this splunk search to get datails about alert actions | rest /services/saved/searches splunk_server=local count=0 |table title,actions
Reflected DDoS Attack
(in reflected attacks a lotof external benign src’s send a lotof packets toward our servers, because our server’s IP spoofed before in request packets and were sent by attacker toward trusted servers and those trusted servers replied us instead of attacker ! ) index=firewall dest=(your company IP range, for example: 184.192.0.0/16) (transport=”udp” AND src_port IN(123,1900,0,53,5353,27015,19,20800,161,389,111,137,27005,520,6881,751,11211,1434,27960,17) AND […]
