1 2 3 4 5 |
index=_audit action=edit* info=granted operation!=list host= object=* | transaction action user operation host maxspan=30s | stats values(action) as action values(object) as modified_object by _time,operation,user,host | rename user as modified_by | table _time action modified_object modified_by |
Splunk dashboard that displays User searches
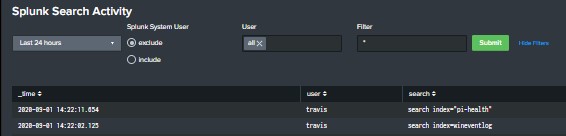
Built this dashboard to give a high level overview of user search activity. The search powering the dashboard is looking that the _audit index and you will need to ensure that you have proper access to the internal Splunk indexes. The dashboard includes a TimeRange picker, radio button to include or exclude Splunk’s system user, […]
Triggered Alert Analytics
Primary Dashboards Contains alert analytics for both triggered alerts and saved searches. Please replace $name$ with the saved search naming convention you utilize (ie. 0001 – AlertName). You will need an outputlookup to generate the bottom two tables; it will be based on the query that generates the second table in the dashboard.
1 2 3 4 5 6 7 8 9 10 11 12 13 14 15 16 17 18 19 20 21 22 23 24 25 26 27 28 29 30 31 32 33 34 35 36 37 38 39 40 41 42 43 44 45 46 47 48 49 50 51 52 53 54 55 56 57 58 59 60 61 62 63 64 65 66 67 68 69 70 71 72 73 74 75 76 77 78 79 80 81 82 83 84 85 86 87 88 89 90 91 92 93 94 95 96 97 98 99 100 101 102 103 104 105 106 107 108 109 110 111 112 113 114 115 116 117 |
<form theme="dark"> <label>Triggered Alert Analytics</label> <description>Metrics tracker for triggered alerts.</description> <fieldset submitButton="false"></fieldset> <row> <panel> <title>alert_fired count for Triggered Alerts</title> <input type="time" token="upperTime" searchWhenChanged="true"> <label></label> <default> <earliest>-7d@h</earliest> <latest>now</latest> </default> </input> <chart> <title>Dashboard for counting per-alert totals, contingent on alerts having the 'Alert Action: Add to Triggered Alerts'</title> <search> <query>index=_audit action=alert_fired ss_app=* ss_name="$name$" | timechart span=1d sum(triggered_alerts) by ss_name useother=f limit=0 | sort -count</query> <earliest>$upperTime.earliest$</earliest> <latest>$upperTime.latest$</latest> <sampleRatio>1</sampleRatio> </search> <option name="charting.axisLabelsX.majorLabelStyle.overflowMode">ellipsisNone</option> <option name="charting.axisLabelsX.majorLabelStyle.rotation">0</option> <option name="charting.axisTitleX.visibility">visible</option> <option name="charting.axisTitleY.visibility">visible</option> <option name="charting.axisTitleY2.visibility">visible</option> <option name="charting.axisX.abbreviation">none</option> <option name="charting.axisX.scale">linear</option> <option name="charting.axisY.abbreviation">none</option> <option name="charting.axisY.scale">log</option> <option name="charting.axisY2.abbreviation">none</option> <option name="charting.axisY2.enabled">0</option> <option name="charting.axisY2.scale">inherit</option> <option name="charting.chart">line</option> <option name="charting.chart.bubbleMaximumSize">50</option> <option name="charting.chart.bubbleMinimumSize">10</option> <option name="charting.chart.bubbleSizeBy">area</option> <option name="charting.chart.nullValueMode">gaps</option> <option name="charting.chart.showDataLabels">none</option> <option name="charting.chart.sliceCollapsingThreshold">0.01</option> <option name="charting.chart.stackMode">default</option> <option name="charting.chart.style">shiny</option> <option name="charting.drilldown">none</option> <option name="charting.layout.splitSeries">0</option> <option name="charting.layout.splitSeries.allowIndependentYRanges">0</option> <option name="charting.legend.labelStyle.overflowMode">ellipsisMiddle</option> <option name="charting.legend.mode">standard</option> <option name="charting.legend.placement">right</option> <option name="charting.lineWidth">2</option> <option name="refresh.display">preview</option> <option name="trellis.enabled">0</option> <option name="trellis.scales.shared">1</option> <option name="trellis.size">medium</option> <option name="trellis.splitBy">ss_name</option> </chart> </panel> </row> <row> <panel> <title>All Modified Alerts (-7d)</title> <input type="time" token="lowerTime" searchWhenChanged="true"> <label></label> <default> <earliest>-7d@h</earliest> <latest>now</latest> </default> </input> <table> <search> <query>| rest /servicesNS/-/-/saved/searches | search title="$name$" | rename dispatch.earliest_time AS "frequency", title AS "title", eai:acl.app AS "app", next_scheduled_time AS "nextRunTime", search AS "query", updated AS "lastUpdated", action.email.to AS "emailTo", action.email.cc AS "emailCC", action.email.subject AS "emailSubject", alert.severity AS "SEV" | eval severity=case(SEV == "5", "Critical-5", SEV == "4", "High-4",SEV == "3", "Warning-3",SEV == "2", "Low-2",SEV == "1", "Info-1") | table title lastUpdated, nextRunTime, emailTo action.lookup.filename, query, severity | fillnull value="" | sort -lastUpdated</query> <earliest>-24h@h</earliest> <latest>now</latest> <sampleRatio>1</sampleRatio> </search> <option name="count">10</option> <option name="dataOverlayMode">none</option> <option name="drilldown">cell</option> <option name="percentagesRow">false</option> <option name="refresh.display">preview</option> <option name="rowNumbers">false</option> <option name="totalsRow">true</option> <option name="wrap">false</option> </table> </panel> </row> <row> <panel> <table> <title>Daily Alert Modification Report</title> <search ref="Daily Alert Modification Report"></search> <option name="drilldown">none</option> </table> </panel> <panel> <table> <title>From 'all_modified_alerts.csv'</title> <search> <query>| from lookup:all_modified_alerts.csv</query> <earliest>0</earliest> <latest></latest> </search> <option name="count">1</option> <option name="drilldown">cell</option> <option name="totalsRow">true</option> </table> </panel> </row> </form> |
Report […]
Show your triggered alerts
This search shows all the alerts that where triggered in your splunk environment:
1 |
index=_audit action=alert_fired ss_app=* | eval ttl=expiration-now() | search ttl>0 | convert ctime(trigger_time) | table trigger_time ss_name severity | rename trigger_time as "Alert Time" ss_name as "Alert Name" severity as "Severity" |
Find unused dashboards
Use this search to find unused dashboards:
1 2 3 4 5 6 7 8 9 10 11 12 13 14 15 |
| rest /servicesNS/-/-/data/ui/views splunk_server=* | search isDashboard=1 | rename eai:acl.app as app | fields title app | join type=left title [| search index=_internal sourcetype=splunk_web_access host=* user=* | rex field=uri_path ".*/(?<title>[^/]*)$" | stats latest(_time) as Time latest(user) as user by title ] | where isnotnull(Time) | eval Now=now() | eval "Days since last accessed"=round((Now-Time)/86400,2) | sort - "Days since last accessed" | convert ctime(Time) | fields - Now |
Admin Notes – Fantastic query! I modified the SPL slightly as I had an issue when I copied it to my two test environments.
Show Searches with Details (Who | When | What)
The following Splunk search will show a list of searches ran on a splunk server with the following details: Who ran the search What sourcetype was used What index was used What the search string was When the search was last ran
1 2 3 4 5 6 |
index=_audit action=search sourcetype=audittrail search_id=* NOT (user=splunk-system-user) search!="'typeahead*" | rex "search\=\'(search|\s+)\s(?P<search>[\n\S\s]+?(?=\'))" | rex field=search "sourcetype\s*=\s*\"*(?<SourcetypeUsed>[^\s\"]+)" | rex field=search "index\s*=\s*\"*(?<IndexUsed>[^\s\"]+)" | stats latest(_time) as Latest by user search SourcetypeUsed IndexUsed | convert ctime(Latest) |