
Quick glance into who’s who in the zoo for users, capabilities, roles, and what indexes are searchable. Also calls out users with can_delete capabilities. Mileage may vary, please comment if there are any issues! <dashboard version=”1.1″> <label>Splunk Insights – Users and Roles</label> <row> <panel> <title>Number of Roles</title> <single> <title>Click to Expand</title> <search> <query>| rest splunk_server=local […]
Splunk License Consumption via _introspection
Just sharing a query I found useful lately when licensing dashboards are being silly. Mileage may vary. index=”_introspection” component=”licensing.stack”| bucket _time span=1d | stats latest(“data.consumption”) as dataConsumption latest(“data.pools{}.quota”) as poolQuota by _time| eval pctUsed=(dataConsumption/poolQuota * 100)| timechart span=1d max(pctUsed)
REST API: Table all Splunk User Email Addresses
The following simple Splunk query will put all Splunk User accounts with an email address into a panel for copy and paste purposes (such as copying all email addresses to send in an email). I’ve added a semi colon delimiter in order to literally be copy and paste into an application such as Microsoft Outlook. […]
Character Count Per Event
Here’s an incredibly simple Splunk query to count the number of characters in an event: index=* | eval CharCount=len(_raw)
Dashboard for Splunk Infrastructure/Server Specs at a Glance
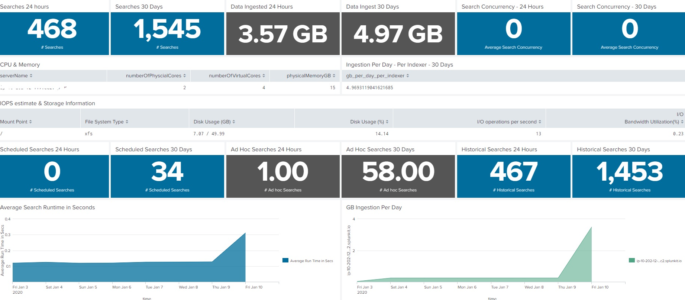
This dashboard will show the server or infrastructure specs of your Splunk environment. This is not intended to replace the Monitoring console, but rather augment as sometimes we need a condensed version of what is going on inside our Splunk environment. I’ve had fun with it on my homelab, so if you find something not […]
Apps Deployed from Deployment Server
Want to show what apps have been deployed to forwarders from a deployment server (DS)? Try this Splunk Search: index=_internal sourcetype=splunkd component=DeployedApplication installing | stats count latest(_time) AS latest_time by host app | convert ctime(latest_time)
List of Forwarders that are Deployment Clients
Need a list of Forwarders that are talking to a Deployment Server? Try this: index=_internal sourcetype=splunkd component=DC* Handshake | stats count by host Additional REST query (performed on the DS) will return desired results (Thanks to Lyx for pointing this out!): | rest /services/deployment/server/clients splunk_server=local | table hostname applications.*.serverclasses | untable hostname, applications, serverclass | […]
Successful Logons to WordPress Admin Area
Ever want more detailed information on authentications to your WordPress Admin Area? This Splunk Query will show detailed information on successful authentications to the wp-admin section of your site: sourcetype=”access_combined” uri=”/wp-admin/admin-ajax.php?_fs_blog_admin=*” | iplocation clientip | stats sparkline latest(_time) as Latest_Date count(status) as count values(status) by uri, Country, Region, City, clientip | convert ctime(Latest_Date) | sort […]
Regex Extraction for WordPress Version from Apache Logs
The following Splunk search extracts the WordPress version from your Apache Web Logs. For fun I also did a time chart using 100% stacked bar chart to show by month each version of wordpress used. This was actually a pretty neat display of colors to show the upgrade path of WordPress over the years! I […]
Utilizing tstats for Page Views within Apache Web Logs
Here’s a Splunk query to show a timechart of page views from a website running on Apache. Due to the search utilizing tstats, the query will return results incredibly fast over a very LONG period of time if desired. Change the index to reflect yours, as well as the span to reflect a span you […]
Successful File Access Attempts and Filename Accessed
Ever need to find when a user accessed a file within a Windows environment? The following Splunk query will show successful file accesses by each user for a given day. Depending on the size of your environment this can get out of hand quickly. You’ll want to tweak to best fit your environment. *Note* you […]
Internal Splunk User Stats
This simple Splunk query will show us unique Splunk user logged into Splunk per day, as well as total count of log-ons. index=_audit info=succeeded | timechart span=1d dc(user) as unique_users count(user) as logons_all_users
Apache Traffic Dashboard
Description: The following Dashboard is what I use to monitor traffic to GoSplunk. It uses the built in sourcetype of access_combined. No additional add-on’s or TA’s are required. I replaced my index with index=* so it’ll work out of the box. You’ll want to change this to your index for best practices. *UPDATE – 2019/05/29* […]
High Level Windows Dashboard
Part 1 – User Logon Activity The following Splunk Dashboard provides a high level view of windows user logon activity. It should be emphasized that the focus of this dashboard is fairly high level, has a time picker (defaulting to 7 days) and shows both successful and failed user logons (table and timechart) as well […]
Use TSTATS to find hosts no longer sending data
This is a simple tstats query shows all hosts and sourcetypes that have reported data, and shows the time in seconds since anything was sent. Be sure to run the query over a lengthy period of time in order to include machines that haven’t sent data for sometime. Don’t worry about the search-time so much, […]
Number of Hosts Associated with a Serverclass
The following query will list the number of hosts associated with all serverclasses on your Splunk Deployment server. This query should be run on your Deployment Server. | rest /services/deployment/server/clients splunk_server=local | table hostname applications.*.serverclasses | untable hostname applications | rex field=applications “applications\.(?<apps>.+)\.serverclasses” | stats dc(hostname) as hostname by apps
Successful Logons – Windows
The following is a Splunk query that will display a timechart for all successful logons to windows: source=”WinEventLog:security” EventCode=4624 Logon_Type IN (2,7,10,11) NOT user IN (“DWM-*”, “UMFD-*”) | timechart span=1h count by host Here’s a detailed table showing similar information with greater detail: source=”WinEventLog:security” EventCode=4624 Logon_Type IN (2,7,10,11) NOT user IN (“DWM-*”, “UMFD-*”) | eval […]
Failed Logon Attempts – Windows
The following Splunk query will show a timechart of failed logon attempts per host: source=”WinEventLog:security” EventCode=4625 | timechart span=1h count by host The following Splunk query will show a detailed table of failed logon attempts per host and user with 5 minute chunks/blocks of time, as well as show a sparkline (mini timechart) within the […]
Show Searches with Details (Who | When | What)
The following Splunk search will show a list of searches ran on a splunk server with the following details: Who ran the search What sourcetype was used What index was used What the search string was When the search was last ran index=_audit action=search sourcetype=audittrail search_id=* NOT (user=splunk-system-user) search!=”‘typeahead*” | rex “search\=\'(search|\s+)\s(?P<search>[\n\S\s]+?(?=\’))” | rex field=search […]
REST API response time
This is a Splunk query to measure REST API response time from the various rest URI’s in Splunk. index=_internal sourcetype=splunkd_access source=*splunkd_access.log | rex “- – – (?P<Response_Time>.*)” | rex “\”(?<REST_uri>[^\”]+)” | table _time, REST_uri, Response_Time Credit goes to somesoni2 on answers.splunk.com! Query found here: https://answers.splunk.com/answers/112073/splunk-query-to-measure-rest-api-response-time.html
