
Quick glance into who’s who in the zoo for users, capabilities, roles, and what indexes are searchable. Also calls out users with can_delete capabilities. Mileage may vary, please comment if there are any issues! <dashboard version=”1.1″> <label>Splunk Insights – Users and Roles</label> <row> <panel> <title>Number of Roles</title> <single> <title>Click to Expand</title> <search> <query>| rest splunk_server=local […]
check expected splunk version with reality
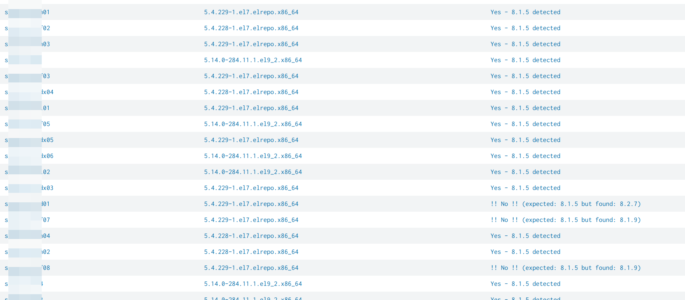
simply query to compare an expected splunk version with reality. simply adjust “expected_version” to your expected version: | rest splunk_server=* /services/server/status/resource-usage/hostwide | table splunk_server splunk_version| eval expected_version=”8.1.5″| eval match_expectation=if(splunk_version == expected_version, “Yes – ” . expected_version . ” detected”, “!! No !! (expected: ” . expected_version . ” but found: ” . splunk_version . “)”)| […]
Get Fields Defined for Multiple KVStore Collections
Description: This query gets all collection titles in your instance, then runs a map function on them to get their fields from a single query. The reason this is necessary is because the API returns collection fields as columns, not values, and if you just table all fields for multiple collections, you’ll end up with […]
REST Call for a list of Alert actions (Webhook_sms or Email or notable or ..)
Use this splunk search to get datails about alert actions | rest /services/saved/searches splunk_server=local count=0 |table title,actions
REST Call for a get details about Alert cron_schedules
Use this splunk search to show Alert’s cron_schedule details: | rest /services/saved/searches splunk_server=local count=0 | search “cron_schedule”=”*/*” |table title,cron_schedule,author
Searching Your Searches
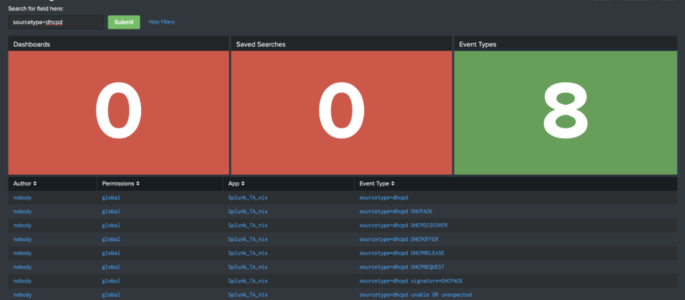
Below is the raw XML of a dashboard we wrote about on our blog a couple of months ago. Click here to read that blog, or copy/paste this XML in your Splunk instance! <form theme=”dark”> <label>Searching for Searches</label> <fieldset submitButton=”true”> <input type=”text” token=”search_input”> <label>Search for field here:</label> </input> </fieldset> <row> <panel> <title>Dashboards</title> <single> <search> <query>| […]
List All Splunk Users & Associated Roles
The following Splunk query will show a table of all users and their roles: | rest /services/authentication/users | stats values(roles) as Roles by user *Admin Notes* I’ve found the following query to work better in my environment: | rest /services/authentication/users | stats values(roles) as Roles by title
Dashboard and App views by user
This Splunk query / search shows historical access to dashboards and apps on a local splunk server. index=_internal sourcetype=splunk_web_access host=* user=* | rex field=uri_path “.*/(?<title>[^/]*)$” | join title [| rest /servicesNS/-/-/data/ui/views splunk_server=* | search isDashboard=1 isVisible=1 | rename eai:acl.app as app | fields title app ] | rename title as dashboard | stats count by […]
REST API response time
This is a Splunk query to measure REST API response time from the various rest URI’s in Splunk. index=_internal sourcetype=splunkd_access source=*splunkd_access.log | rex “- – – (?P<Response_Time>.*)” | rex “\”(?<REST_uri>[^\”]+)” | table _time, REST_uri, Response_Time Credit goes to somesoni2 on answers.splunk.com! Query found here: https://answers.splunk.com/answers/112073/splunk-query-to-measure-rest-api-response-time.html
identify knowledge objects, permissions and extractions
The following will: list all knowledge objects for your SH (or given search peer(s)) each objects name, type, app, permissions, sharing (e.g. global, app, private) and owner if props-extract: the props stanza, props type (e.g if its Inline or Transforms), props sourcetype and props value (e.g. the regex) if transforms-extract: the state (tf_disabled), format (tf_format), tf_fields […]
List permissions for Users, roles, allowed indexes and indexes searched by default
Ok that one is a big one so be prepared ;) The following will (on a SH / SH Cluster): list all users and their roles list inherited roles list all indexes allowed by the shown roles list all indexes allowed for inherited roles (one level!) inherited allowed indexes will show the originator (which inherited […]
Show Splunk User to Role mapping
The following Splunk REST query shows all roles, number of capabilities, and landing app for each user. | rest /services/authentication/users | eval name=coalesce(realname, title) | stats values(roles) as Role first(defaultApp) as “Landing App” count(capabilities) as “Number of Capabilities” by name
Show all Indexes and Sourcetypes via REST
The following Splunk query uses REST to display non internal indexes associated with sourcetypes. It is my understanding that this is all time (such is the way of REST searches) | rest /services/data/inputs/all | search index!=_* | stats values(sourcetype) by index
User Info Dashboard – Using REST
I found this very useful user statistics/information splunk dashboard on www.function1.com/2016/06/rest-easy-with-the-splunk-rest-api. They have additional Splunk REST queries and examples worth checking out! <dashboard> <label>REST API: access control</label> <row> <panel> <single> <title>You are</title> <searchString>| rest /services/authentication/current-context | where NOT username=”splunk-system-user” | fields username</searchString> <earliestTime>0</earliestTime> <latestTime/> <option name=”drilldown”>none</option> […]
Use REST to gather Index Info
Here is some SPL to get useful information via REST on indexes within your Splunk environment: | REST /services/data/indexes | eval currentDBSizeMB=tostring(currentDBSizeMB, “commas”) | eval totalEventCount=tostring(totalEventCount, “commas”) | eval frozenTimePeriodInHours=(frozenTimePeriodInSecs/60/60) | table title splunk_server currentDBSizeMB frozenTimePeriodInHours maxTime minTime totalEventCount
List of Alerts via REST
The following Splunk search (query) will show a list of alerts within Splunk via the | rest call: | rest /services/alerts/fired_alerts splunk_server=local| table eai:acl.owner eai:acl.app id title triggered_alert_count
List Inputs using REST
As the title says. Pretty nice Splunk Search if you’ve forgotten what inputs you have configured and need a central place to list them. | rest /services/data/inputs/all | convert ctime(starttime) AS “Start Time” | convert ctime(endtime) AS “End Time” | table index interval source sourcetype title updated starttime endtime “Start Time” “End Time”
Show all currently logged in users
Use this Splunk rest query to list all currently logged in users (to your Splunk server). | rest /services/authentication/current-context | search NOT username=”splunk-system-user” | table username roles updated
REST Call for Memory & CPU usage on Splunk Servers
This Splunk search will show you use and available CPU and Memory statistics. Depending on your environment you may see multiple Splunk servers: | rest /services/server/status/resource-usage/hostwide | eval cpu_count = if(isnull(cpu_count), “N/A”, cpu_count) | eval cpu_usage = cpu_system_pct + cpu_user_pct | eval mem_used_pct = round(mem_used / mem * 100 , 2) | eval mem_used = […]
REST Call for a list of Lookup Files
Use this splunk search to get a list of all lookup files: | rest /services/data/transforms/lookups | table eai:acl.app eai:appName filename title fields_list updated id
