exploremydata – data explorer

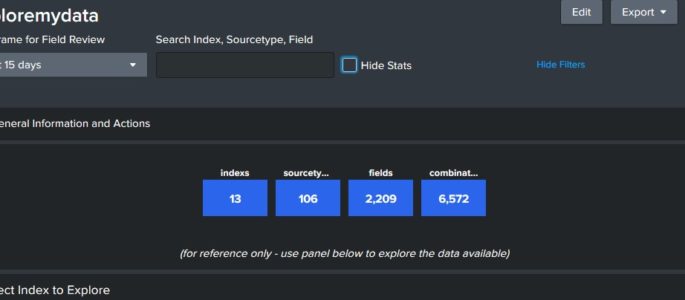
This dashboard provides and overview of the data that is available to query. Click on the index below to review source types in that index, and then a sourcetype to review fields. Finally, you can click on a field to see sample values in that field. Click “Show Filters” above to open a search window […]

Continue Reading →

Splunk License Consumption via _introspection

Just sharing a query I found useful lately when licensing dashboards are being silly. Mileage may vary. index=”_introspection” component=”licensing.stack”| bucket _time span=1d | stats latest(“data.consumption”) as dataConsumption latest(“data.pools{}.quota”) as poolQuota by _time| eval pctUsed=(dataConsumption/poolQuota * 100)| timechart span=1d max(pctUsed)

Continue Reading →

List of Forwarders that are Deployment Clients

Need a list of Forwarders that are talking to a Deployment Server? Try this: index=_internal sourcetype=splunkd component=DC* Handshake | stats count by host Additional REST query (performed on the DS) will return desired results (Thanks to Lyx for pointing this out!): | rest /services/deployment/server/clients splunk_server=local | table hostname applications.*.serverclasses | untable hostname, applications, serverclass | […]

Continue Reading →

Host not sending logs for x days

This Splunk Query will show hosts that stopped sending logs for at least 48 hours. You’ll want to change the time range to be relevant to your environment, and you may need to tweak the 48 hour range to something that is more appropriate for your environment. | tstats count as countAtToday latest(_time) as lastTime […]

Continue Reading →

Use TSTATS to find hosts no longer sending data

This is a simple tstats query shows all hosts and sourcetypes that have reported data, and shows the time in seconds since anything was sent. Be sure to run the query over a lengthy period of time in order to include machines that haven’t sent data for sometime. Don’t worry about the search-time so much, […]

Continue Reading →

Number of Hosts Associated with a Serverclass

The following query will list the number of hosts associated with all serverclasses on your Splunk Deployment server. This query should be run on your Deployment Server. | rest /services/deployment/server/clients splunk_server=local | table hostname applications.*.serverclasses | untable hostname applications | rex field=applications “applications\.(?<apps>.+)\.serverclasses” | stats dc(hostname) as hostname by apps

Continue Reading →

Show Searches with Details (Who | When | What)

The following Splunk search will show a list of searches ran on a splunk server with the following details: Who ran the search What sourcetype was used What index was used What the search string was When the search was last ran index=_audit action=search sourcetype=audittrail search_id=* NOT (user=splunk-system-user) search!=”‘typeahead*” | rex “search\=\'(search|\s+)\s(?P<search>[\n\S\s]+?(?=\’))” | rex field=search […]

Continue Reading →

List All Splunk Users & Associated Roles

The following Splunk query will show a table of all users and their roles: | rest /services/authentication/users | stats values(roles) as Roles by user *Admin Notes* I’ve found the following query to work better in my environment: | rest /services/authentication/users | stats values(roles) as Roles by title

Continue Reading →

Dashboard and App views by user

This Splunk query / search shows historical access to dashboards and apps on a local splunk server. index=_internal sourcetype=splunk_web_access host=* user=* | rex field=uri_path “.*/(?<title>[^/]*)$” | join title [| rest /servicesNS/-/-/data/ui/views splunk_server=* | search isDashboard=1 isVisible=1 | rename eai:acl.app as app | fields title app ] | rename title as dashboard | stats count by […]

Continue Reading →

Show Splunk User to Role mapping

The following Splunk REST query shows all roles, number of  capabilities, and landing app for each user. | rest /services/authentication/users | eval name=coalesce(realname, title) | stats values(roles) as Role first(defaultApp) as “Landing App” count(capabilities) as “Number of Capabilities” by name

Continue Reading →

Total Number of Hosts reporting in.

This query will list the total number of hosts reporting to the indexer for any specified time range. This only works for universal forwarders. If you have hosts reporting in over syslog (typically port 514) they will not be listed. index=_internal sourcetype=splunkd | stats dc(hostname) as “Number of Hosts”

Continue Reading →

Detailed list of Universal Forwarders Reporting to Indexer

The following query will list in detail information on the universal forwarders checking into the indexer. I’ve renamed some of the fields to be more user-friendly. index=_internal sourcetype=splunkd destPort!=”-“| stats sparkline count by hostname, sourceHost, host, destPort, version | rename destPort as “Destination Port” | rename host as “Indexer” | rename sourceHost as “Universal Forwarder […]

Continue Reading →

Splunk User Search Activity

This will return a table of users who conducted searches, the total time it took for searches to complete, a count of said searches, and the last time a search was conducted. *NOTE* You will need to modify “splunk_server=local” specifically the “local” section to represent your Splunk server. index=_audit splunk_server=local action=search (id=* OR search_id=*) | […]

Continue Reading →