check expected splunk version with reality

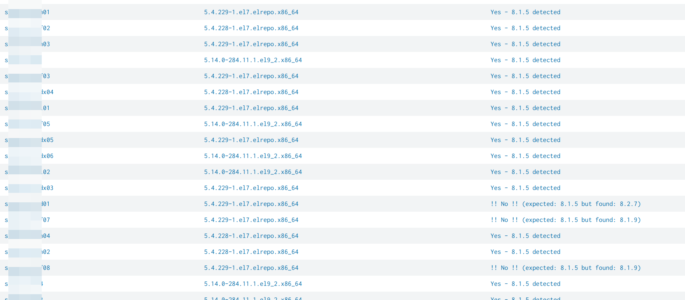
simply query to compare an expected splunk version with reality. simply adjust “expected_version” to your expected version: | rest splunk_server=* /services/server/status/resource-usage/hostwide | table splunk_server splunk_version| eval expected_version=”8.1.5″| eval match_expectation=if(splunk_version == expected_version, “Yes – ” . expected_version . ” detected”, “!! No !! (expected: ” . expected_version . ” but found: ” . splunk_version . “)”)| […]

Continue Reading →

Detect Dying Sourcetypes

This alert is used for looking at a prior dataset of indexes and sourcetypes reporting over time, and then involves pairing to a closer, temporal dataset. Appending the results allows you to view sourcetypes that have stopped reporting, but existed in the prior period.   | tstats count where earliest=-90d latest=-60d index=proxies_na by _time sourcetype […]

Continue Reading →

List Deployment Client

index=_internal sourcetype=splunkd “deployment_client” |stats latest(_time) as LatestReportTime values(server_name) as Server_Name by host |convert ctime(LatestReportTime) |rename host as Host |fields + Host Server_Name LatestReportTime

Continue Reading →

Significant Data Ingress/Egress

Generally, one expects a client-server conversation to be greater on the download side rather than more data uploaded.  This search can detect greater upload than download over a time period, like a client sending significantly more data than it receives from a server (e.g. data ex-filtration). For the best search results, query on a sourcetype […]

Continue Reading →

Apdex Score

Apdex Score Apdex is a measure of response time based against a set threshold. It measures the ratio of satisfactory response times to unsatisfactory response times. The response time is measured from an asset request to completed delivery back to the requestor. It determines user satisfaction, and is based on request type & response time. All […]

Continue Reading →

find blocking queues

Blocked queues are (obviously) bad for your environment so here a search to identify those: index=_internal sourcetype=splunkd group=queue (name=parsingQueue OR name=indexqueue OR name=tcpin_queue OR name=aggqueue) | eval is_blocked=if(blocked==”true”,1,0), host_queue=host.” – “.name | stats sparkline sum(is_blocked) as blocked,count by host_queue | eval blocked_ratio=round(blocked/count*100,2) | sort 20 -blocked_ratio | eval requires_attention=case(blocked_ratio>50.0,”fix highly recommended!”,blocked_ratio>40.0,”you better check..”,blocked_ratio>20.0,”usually no need […]

Continue Reading →

count all events for 1 or multiple index(es)

Total count of all events for 1 or more index(es) Approach 1 (fastest) | eventcount index=foo or | eventcount index=foo index=bar does *not* support time ranges in the time picker tested on: splunk v6.6 Approach 2 (fast – especially when tsidx are *not* reduced) | tstats count where index=foo OR index=bar by span=1d _time index […]

Continue Reading →

Compare Successful Internal Vs External Connections

This query will display a bar chart of all successful Internal vs External SSH connections. Useful for identifying any spikes in connectivity coming from within your network remit or outside of it. Simply change the CIDR matches to match your required LANs. “sshd” AND “Accepted password” | rex “[a-zA-z]{3}\s\d+\s\d+:\d+:\d+\s[a-zA-Z0-9-.]*\s[a-zA-z]{3}\s\d+\s\d+:\d+:\d+\s(?<hostname>.*)\ssshd\[\d+\]:\sAccepted\spassword\sfor\s(?<username>.*)\sfrom\s(?<sourceip>.*)\sport\s(?<sourceport>.*)\sssh2” | eval network=case(cidrmatch(“192.168.0.0/24″, sourceip),”Internal”,   cidrmatch(“10.10.0.0/16″,sourceip),”Internal”, […]

Continue Reading →

Top Offending SSH Failure by Source IP

This displays a list of failed attempts against each connecting IP. Can be used to detect brute force from a particular source IP. You can then put a block up via ACL or whatever method you chose to mitigate the issue. The NOT clause on the first line ignore all attempts to logon to “invalid […]

Continue Reading →