
Description: This Splunk search searches all your saved searches for a specific keyword. Handy if you need to identify all searches that use a specific index, sourcetype or other keyword. Query: |rest /servicesNS/-/-/saved/searches add_orphan_field=yes count=0 | rename eai:acl.app AS app | rename eai:acl.app AS app | search qualifiedSearch=*keyword* | table title, cron_schedule, author, app, […]
Correlation Search Audit Search
Use this search to audit your correlation searches. It includes various information like who is the author of the correlation search, who modified it, etc. In addition to that, the search also gives you an brief info on whether the correlation search has been triggered in past 30 days or not considering it has notable […]
List the size of lookup files with an SPL search.
| rest splunk_server=local /services/data/lookup-table-files/ | rename eai:acl.app as app | table app title | search NOT title IN (*.kmz) | map maxsearches=990 search=”| inputlookup $title$ | eval size=0 | foreach * [ eval size=size+coalesce(len(‘<<FIELD>>’),0), app=\”$app$\”, title=$title$ | fields app title size]” | stats sum(size) by app title | sort – sum(size)
Detect Credit Card Numbers using Luhn Algorithm
Description Detect if any log file in Splunk contains Credit Card numbers. index=* ((source IN(“*.log”,”*.bak”,”*.txt”, “*.csv”,”/tmp*”,”/temp*”,”c:\tmp*”)) OR (tag=web dest_content=*)) | eval comment=”Match against the simple CC regex to narrow down the events in the lookup” | rex max_match=1 “[\”\s\’\,]{0,1}(?<CCMatch>[\d.\-\s]{11,24})[\”\s\’\,]{0,1}” | where isnotnull(CCMatch) | eval comment=”Apply the LUHN algorithm to see if the CC number […]
DNS search for encoded data
Description: Use this Splunk search to find Base64 encoded content in DNS queries. The goal is to examine the DNS query field of the dns events to find subdomain streams that contain only Base64 valid characters. Utilizing DNS queries with encoded information is a known method to exfiltrate data. But you do not know if […]
Show cron frequency and scheduling of all scheduled searches
This search shows you all scheduled searches and their respective cron frequency and cron schedule. This also helps finding frequently running saved searches. | rest splunk_server=local “/servicesNS/-/-/saved/searches/” search=”is_scheduled=1″ search=”disabled=0″ | fields title, cron_schedule, eai:acl.app | rename title as savedsearch_name | eval pieces=split(cron_schedule, ” “) | eval c_min=mvindex(pieces, 0), c_h=mvindex(pieces, 1), c_d=mvindex(pieces, 2), c_mday=mvindex(pieces, 3), c_wday=mvindex(pieces, […]
Data model Acceleration Details
This Splunk Search shows you a lot of good information about your data model acceleration and performance. | rest /services/admin/summarization by_tstats=t splunk_server=local count=0 | eval key=replace(title,((“tstats:DM_” . ‘eai:acl.app’) . “_”),””), datamodel=replace(‘summary.id’,((“DM_” . ‘eai:acl.app’) . “_”),””) | join type=left key [| rest /services/data/models splunk_server=local count=0 | table title, “acceleration.cron_schedule”, “eai:digest” | rename title as key | […]
Remove mulitple values from a multivalue field
This Splunk search is an example on how to remove unwanted values from multivalue fields using mvfilter. | gentimes start=-1 | eval field1=”pink,fluffy,unicorns” | table field1 | makemv field1 delim=”,” | eval field1_filtered=mvfilter(NOT match(field1,”pink”) AND NOT match(field1,”fluffy”))
List all your existing indexes or check if index exists
With this spl you can check what indexes exist or if you want to search for a specific index. List all indexes: |rest /services/data/indexes | fields title | rename title AS index Or check if a specific index exist use: |rest /services/data/indexes | fields title | rename title AS index | search index=yourindex
Datamodel Search Performance
See how well your DM searches are running. Run this search using the Line Chart visualization: index=_internal sourcetype=scheduler component=SavedSplunker ACCELERATE NOT skipped run_time=* | rex field=savedsearch_id “ACCELERATE_(?:[A-F0-9\-]{36}_)?(?<acceleration>.*?)_ACCELERATE” | timechart span=5m max(run_time) AS run_time by acceleration
Breathing Fire Dragon when Starting dbx_task_server
index=_internal sourcetype=dbx_server Starting dbx_task_server Will return events that display a little dragon ascii art: |\___/| (,\ /,)\ / / \ (@_^_@)/ \ W//W_/ \ (//) | \ (/ /) _|_ / ) \ (// /) ‘/,_ _ _/ (~^-. (( // )) ,-{ _ `. (( /// )) ‘/\ / | (( ///)) `. { […]
Show your triggered alerts
This search shows all the alerts that where triggered in your splunk environment: index=_audit action=alert_fired ss_app=* | eval ttl=expiration-now() | search ttl>0 | convert ctime(trigger_time) | table trigger_time ss_name severity | rename trigger_time as “Alert Time” ss_name as “Alert Name” severity as “Severity”
Evaluate Fahrenheit to Celsius
Quick snippet to evaluate temperature Fahrentheit to Celsius: | eval Temperature_Fahrenheit=Temperature_Celsius*1.8+32
Find unused dashboards
Use this search to find unused dashboards: | rest /servicesNS/-/-/data/ui/views splunk_server=* | search isDashboard=1 | rename eai:acl.app as app | fields title app | join type=left title [| search index=_internal sourcetype=splunk_web_access host=* user=* | rex field=uri_path “.*/(?<title>[^/]*)$” | stats latest(_time) as Time latest(user) as user by title ] | where isnotnull(Time) | eval Now=now() | […]
Check your strftime is correct in the props.conf
A simple method on checking if your strftime (TIME_FORMAT=) in the props.conf matches your log file timestamp format. strftime(X,Y) This function takes a UNIX time value, X, as the first argument and renders the time as a string using the format specified by Y. The UNIX time must be in seconds. Use the first 10 […]
Saved Search Scheduler Activity
I use this query a lot to tune and adjust scheduling, find out what searches need attention: index=_internal sourcetype=scheduler result_count | extract pairdelim=”,”, kvdelim=”=”, auto=f | stats avg(result_count) min(result_count) max(result_count), sparkline avg(run_time) min(run_time) max(run_time) sum(run_time) values(host) AS hosts count AS execution_count by savedsearch_name, app | join savedsearch_name type=outer [| rest /servicesNS/-/-/saved/searches | fields title eai:acl.owner […]
Show indexing queue sizes
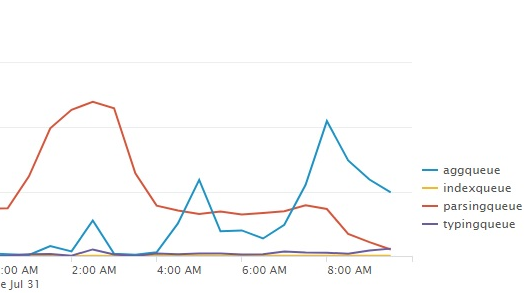
Use a linechart with this search to show you the indexing queue sizes: index=_internal source=*metrics.log group=queue (name=parsingqueue OR name=indexqueue OR name=typingqueue OR name=aggqueue) | timechart avg(current_size) by name
Percentage of skipped searches
This query will give you a table with a percentage of skipped searches and an evaluation with 3 ranges index=_internal sourcetype=scheduler | stats count as total, count(eval(status=”skipped”)) as skipped | eval pct=round(skipped/total * 100, 0) | rangemap field=pct low=0-10, elevated=10-20 severe=20-100 | eval pct = pct . “%” | fields pct, range
Retention Period in days per index
This query will give you a table of all indexes and their respective retention period in days: | rest splunk_server=* /services/data/indexes | join type=outer title [ | rest splunk_server=* /services/data/indexes-extended ] | eval retentionInDays=frozenTimePeriodInSecs/86400 | table title retentionInDays
Bucket Count by indexer/index
This search displays the amount of buckets per indexer/index To learn more about the | dbinspect command go to: http://docs.splunk.com/Documentation/Splunk/7.1.2/SearchReference/Dbinspect |dbinspect index=* | search index!=_* | chart dc(bucketId) over splunk_server by index
