Description: Splunk Threat Research team (STRT) does a good job at keeping up with new analytics. However, for smaller deployments it can be difficult to sort through what is applicable and/or what has changed when these new versions are available. They have a solution for a larger organization to be able to track and test […]
Dashboard: Splunk Insights – Users & Roles
Quick glance into who’s who in the zoo for users, capabilities, roles, and what indexes are searchable. Also calls out users with can_delete capabilities. Mileage may vary, please comment if there are any issues! <dashboard version=”1.1″> <label>Splunk Insights – Users and Roles</label> <row> <panel> <title>Number of Roles</title> <single> <title>Click to Expand</title> <search> <query>| rest splunk_server=local […]
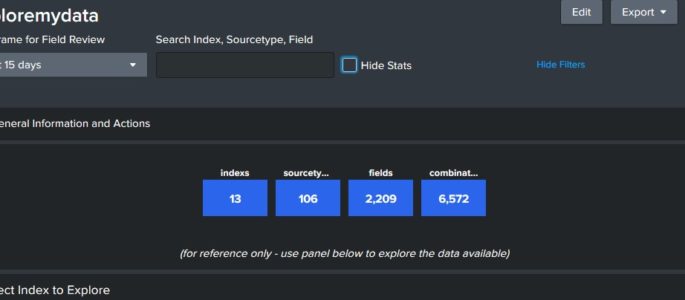
exploremydata – data explorer
This dashboard provides and overview of the data that is available to query. Click on the index below to review source types in that index, and then a sourcetype to review fields. Finally, you can click on a field to see sample values in that field. Click “Show Filters” above to open a search window […]
Dashboard sourcetype validation
Wanted a dashboard supporting checks on a sourcetype to see at the same time: how data where ingested, where and get an overview of samples and fields summary what is the stanza configuration (following the 9-step sequence) this dashboard uses internal rest API (| rest) before running dashboard a lookup table (CSV) and a lookup […]
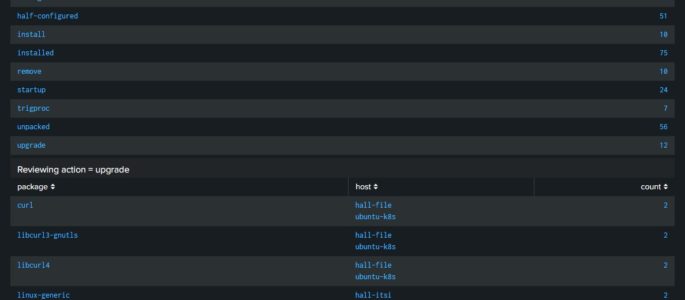
NIX Debian Package (dpkg.log) Dashboard
Description: Wanted a dashboard that would provide information around package information across my Ubuntu servers. At this time I have only built this dashboard to review the “dpkg.log”. In an attempt to help people understand how I build dashboard, posted a video on YouTube where you can follow along while I build this dashboard out: […]
Dashboard to measure Indexes and Sourcetypes, based upon first and last date of events
This dashboard will use REST API endpoints to grab a list of all indexes and then map out by sourcetype how many events when the first one was (based upon _time) and the last. Then does basic date math to show how long of a period that is as retention (though it does not show […]
Truncated Data Issues
Displays sourcetypes being truncated on ingest, then on selection, shows the related _internal message & the an event that caused it to trigger. <form> <label>Data Issues</label> <description>Truncation, Date Parsing and Timestamp issues</description> <fieldset submitButton=”false”> <input type=”time” token=”field1″> <label></label> <default> <earliest>-24h@h</earliest> <latest>now</latest> </default> </input> </fieldset> <row> <panel> <title>Choose a problematic sourcetype</title> <table> <search> <query>index=_internal sourcetype=splunkd component=LineBreakingProcessor […]
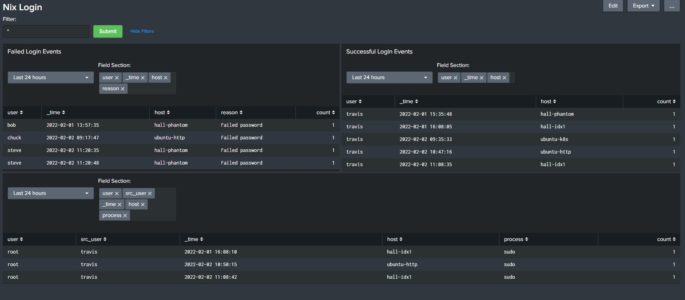
NIX Login Dashboard with Success, Failed and Sudo activity
Description: Built this dashboard to display login activity for my *nix host devices. At the top you have a box called “Filter” that allows you to insert search parameters in the base search (ex: user=thall). Each panel has it’s own “TimeRangePicker” and a “Multiselect input” which allows you to decide what fields to add to […]
Software inventory
I’ve been looking a while for something like this, and decided to make it myself. This relies on the tinv_software _inventory add-on found on Splunkbase, but you can do it without, if you feel like it. <form> <label>Software Inventory</label> <fieldset submitButton=”false” autoRun=”false”> <input type=”dropdown” token=”software_picker” searchWhenChanged=”true”> <label>Software</label> <choice value=”"falcon-sensor" "Crowdstrike Windows Sensor"”>Crowdstrike</choice> <choice value=”"*qualys*"”>Qualys</choice> <choice […]
Deployed application status
Created this dashboard to see when or if an application was deployed successfully. Close to splunkninja’s query, this will also show if the host in question also restarted to apply the new app. <form> <label>Deployed Applications</label> <fieldset submitButton=”false”> <input type=”checkbox” token=”loglevelpicker” searchWhenChanged=”true”> <label>Log Level</label> <choice value=”INFO”>INFO</choice> <choice value=”WARN*”>WARNING</choice> <choice value=”ERROR”>ERROR</choice> <default>INFO,WARN*,ERROR</default> <valuePrefix>log_level=</valuePrefix> <delimiter> OR […]
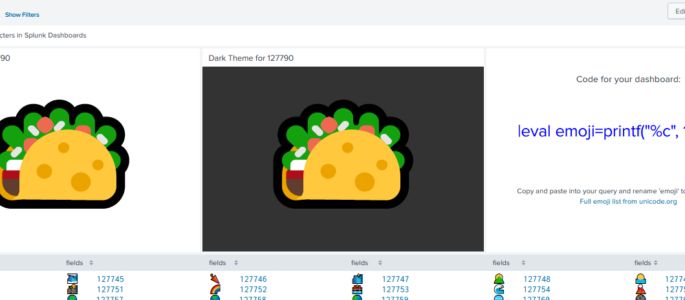
emoji bonanza
Have you ever wanted to truly express your emotions related to your search results but wasn’t sure how? Why not use an emoji? But how, you ask? Well, problem solved. Welcome to the emoji bonanza! <form theme=”light” hideFilters=”true”> <label>emoji bonanza</label> <!— Welcome to the emoji bonanza. A friend figured out how to get emoji in […]
ProofPoint TAP Dashboard
<form> <label>TAP Dashboard</label> <description>Direct pull from TAP API</description> <fieldset autoRun=”true” submitButton=”false”> <input type=”time” token=”time” searchWhenChanged=”true”> <label>Select Time</label> <default> <earliest>@d</earliest> <latest>now</latest> </default> </input> </fieldset> <row> <panel> <title>Quarantine Trends</title> <chart> <search> <query>sourcetype=proofpoint_tap quarantineFolder=* AND quarantineFolder!=”” | stats dc(messageID) AS distinct_message_ids by quarantineFolder | sort -distinct_message_ids</query> <earliest>$earliest$</earliest> <latest>$latest$</latest> </search> <option name=”charting.chart”>pie</option> <option name=”charting.chart.showDataLabels”>all</option> <option name=”charting.drilldown”>all</option> <option name=”charting.legend.placement”>none</option> <option […]
Bucket Status Dashboard
Shows status of buckets per indexer host, when they rolled from warm to cold, and cold to frozen. Gives a timechart and table of each, as well as detailed bucket names per index & host. <form> <label>Bucket Status</label> <fieldset submitButton=”false”> <input type=”time” token=”field1″> <label></label> <default> <earliest>-24h@h</earliest> <latest>now</latest> </default> </input> <input type=”multiselect” token=”hostpicker” searchWhenChanged=”true”> <label>Which Host</label> […]
Alerts in a Panel with Drilldown
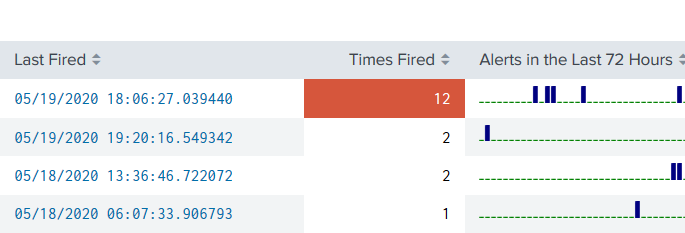
A quick dashboard panel you can plop anywhere and get a view of alerts that have recently fired, including a drilldown based on the SID of the fired alert. <row> <panel> <table> <title>Alerts Fired</title> <search> <query>index=_audit action=alert_fired |rename ss_name AS Alert |stats latest(_time) AS “Last Fired” count AS “Times Fired” sparkline AS “Alerts in the […]
Triggered Alert Analytics
Primary Dashboards Contains alert analytics for both triggered alerts and saved searches. Please replace $name$ with the saved search naming convention you utilize (ie. 0001 – AlertName). You will need an outputlookup to generate the bottom two tables; it will be based on the query that generates the second table in the dashboard. <form theme=”dark”> […]
Dashboard for Splunk Infrastructure/Server Specs at a Glance
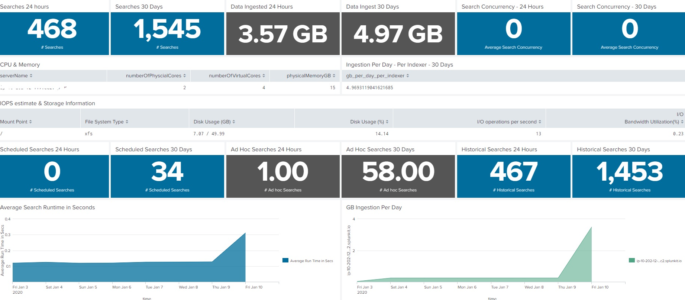
This dashboard will show the server or infrastructure specs of your Splunk environment. This is not intended to replace the Monitoring console, but rather augment as sometimes we need a condensed version of what is going on inside our Splunk environment. I’ve had fun with it on my homelab, so if you find something not […]
Windows Dashboard showing Who (was) logged on to ?
Dashboard with 3 separate columns which allow you to drill into 3 separate assets to find out who was logged on, when they logged on, and how they logged on. Accounts for remote logins, local logins, and unlocks/reconnects accounted for but not Type 3 (network logons for shared file access etc). Time picker set so […]
Nessus Security Center Dashboard
Description: This dashboard is intended make it easier to search the results from Nessus Security Center. It doesn’t require any additional addons. <form> <label>Nessus Scan Results</label> <fieldset submitButton=”true” autoRun=”false”> <input type=”checkbox” token=”t_severity”> <label>Severity</label> <choice value=”Critical”>Critical</choice> <choice value=”High”>High</choice> <choice value=”Medium”>Medium</choice> <choice value=”Low”>Low</choice> <prefix>(</prefix> <suffix>)</suffix> <initialValue>Critical,High,Medium,Low</initialValue> <valuePrefix>severity.name=</valuePrefix> <delimiter> OR </delimiter> </input> <input type=”multiselect” token=”t_scan_name”> <label>Scan Name</label> <choice […]
FireEye Internals Monitoring
Summary: FireEye produces 2 types of logs: security event logs (the primary function of FireEye), and internal system logs (Logs about the appliance). Most users do not use the internal system logs, or are even aware that they are available. Sometimes, the appliances are configured to send both logs via syslog, and the messages are […]
Windows Sysmon Process Dashboard
(updated on 8/26/2020) Working with a customer I started this dashboard to give a high level overview of Windows Sysmon data. I have been evolving the dashboard in my home environment and will take any feedback to improve the effectiveness of this dashboard. First is getting sysmon data into your splunk environment. My home computers […]

