
Description: This dashboard is designed to simplify Splunk’s LDAPSEARCH command. LDAP must be configured in your Splunk instance for this to work. <form> <label>LDAP objectClass/CN/OU Search</label> <description>LDAPSEARCH Dashboard.</description> <fieldset submitButton=”true” autoRun=”false”> <input type=”radio” token=”objectClass_field”> <label>objectClass</label> <default>*</default> <choice value=”*”>Any objectClass</choice> <choice value=”user”>Users</choice> <choice value=”computer”>Computers</choice> </input> <input type=”text” token=”cn_field”> <label>CN</label> <default>*</default> </input> <input type=”text” token=”ou_field”> <label>OU</label> […]
Windows Logon Dashboard
Windows dashboard to help identify users that have either failed or successfully logged in. At the top you have a box I called “Filter” that allows you to insert search parameters in the base search (ex: user=thall). Each panel has it’s own TimeRangePicker and a field selection box which allows you to decide what fields […]
License and Storage Usage Dashboard
This relies on the search posted earlier: This will display storage and license usage broken down by groups, predefined in the chargeback app customers.csv <form> <label>License and Storage Usage</label> <fieldset submitButton=”false”> <input type=”dropdown” token=”grouppicker”> <label>Group</label> <choice value=”Group1″>Group1</choice> <choice value=”Group2″>Group2</choice> <choice value=”Group3″>Group3</choice> <choice value=”Group4″>Group4</choice> <choice value=”Group5″>Group5</choice> <choice value=”Group6″>Group6</choice> <choice value=”*”>All Groups</choice> <default>*</default> </input> </fieldset> <row> <panel> […]
Windows RDP sessions
Here is a dashboard I built to look at Windows Logon Type 2 & 10 (remote & remote interactive) that will help identify which users access which servers and how many times. Also when you click on a user it will run a 30 day search and a 24 hour search that produces a column […]
Apache Traffic Dashboard
Description: The following Dashboard is what I use to monitor traffic to GoSplunk. It uses the built in sourcetype of access_combined. No additional add-on’s or TA’s are required. I replaced my index with index=* so it’ll work out of the box. You’ll want to change this to your index for best practices. *UPDATE – 2019/05/29* […]
Windows service activity & MSI installs
Here is a dashboard I built to help you understand the activity of services and MSI installs within a Windows machine. This dashboard utilizes Post Processing so there is only 2 searches that are launched when the dashboard is loaded to minimize impact on search queuing. Add-on’s: Splunk Add-on for Microsoft Windows – https://splunkbase.splunk.com/app/742/ Video overview […]
Windows Account Management Dashboard
Here is a dashboard that I have built to look at Windows Account Management events. The dashboard utilizes a drill-down that will feed a multi-select which is using a dynamic search to give you fields that are available for the stats output in 2nd panel dependent on your selection. Add-on’s: Splunk Add-on for Microsoft Windows […]
Simple File Integrity Monitoring Management Dashboard
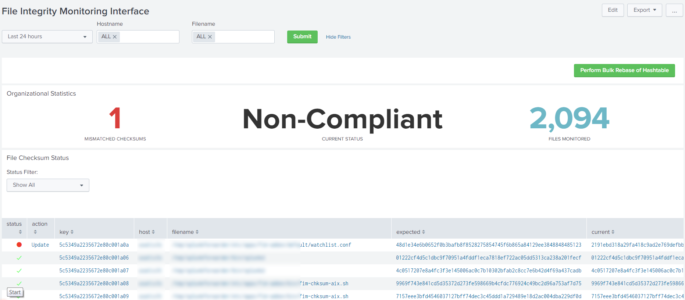
This is the code for my original reddit post at https://www.reddit.com/r/Splunk/comments/am3tgr/simple_file_integrity_monitoring/ This dashboard allows users to manage simple File Integrity Monitoring (FIM) within Splunk. Please note that this isn’t a full FIM suite as it only validates if a checksum has been changed on a file, but I have included a simple TA for Linux. However, if you […]
Auditd hosts in all environments
Shows the login activity to our linux environments, sudo commands per host and users. Admin Notes: index=main was changed to index=* due to not everyone using the same index. This dashboard has been tested for code errors, but not for search errors. Please comment if you have any issues! <form> <label>Audit All Hosts</label> <fieldset submitButton=”false”> […]
Searching Your Searches
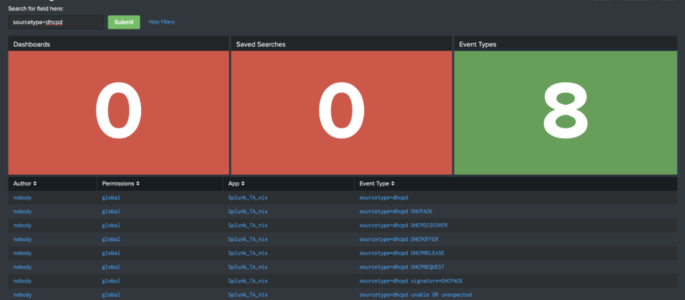
Below is the raw XML of a dashboard we wrote about on our blog a couple of months ago. Click here to read that blog, or copy/paste this XML in your Splunk instance! <form theme=”dark”> <label>Searching for Searches</label> <fieldset submitButton=”true”> <input type=”text” token=”search_input”> <label>Search for field here:</label> </input> </fieldset> <row> <panel> <title>Dashboards</title> <single> <search> <query>| […]
High Level Windows Dashboard
Part 1 – User Logon Activity The following Splunk Dashboard provides a high level view of windows user logon activity. It should be emphasized that the focus of this dashboard is fairly high level, has a time picker (defaulting to 7 days) and shows both successful and failed user logons (table and timechart) as well […]
