This is the code for my original reddit post at https://www.reddit.com/r/Splunk/comments/am3tgr/simple_file_integrity_monitoring/
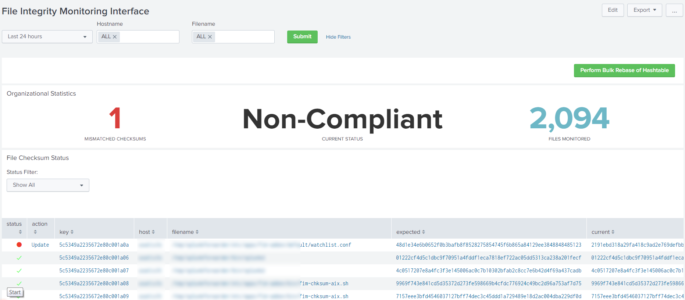
This dashboard allows users to manage simple File Integrity Monitoring (FIM) within Splunk. Please note that this isn’t a full FIM suite as it only validates if a checksum has been changed on a file, but I have included a simple TA for Linux. However, if you or your organization just need a simple “Has something been changed” then this should suffice. This dashboard provides the ability to modify verification hashtables and includes audit logging as well. Here are the highlights:
- Has an audit log of any action performed within the interface
-
Auto refreshes tables when actions are completed.
-
Batch level rebasing of the verification hashtable with asynchronous modal window to prevent accidental clicks
-
Only allows updates for items that have been modified via a table usually defined mismatches
-
Filters to prevent alert fatigue
There is quite a bit of backend code for this dashboard, so I will attempt to provide all the code with explanations as well. Staring with getting data into the system.
../default/inputs.conf
[script://.bin/fim-nix.sh]
disabled = 0
index = <index_name>
sourcetype = fim
source = fim
interval = 900
../bin/fim-nix.sh
WATCHLIST="../default/watchlist.conf"

while read line; do
   echo -n "checksum" && shasum $line
done < $WATCHLIST
This script uses a file called watchlist.conf that is placed in the default folder of the TA. Then you just need to add the fullpath of the file you want to monitor one file per line, like this:
../default/watchlist.conf
/home/username/file1.txt
/home/username/file2.txt
That covers the TA. The output should be something similar to the following:
checksum 12345678900987654321 /home/username/file1.txt
Now for the dashboard. This dashboard uses custom JS and KVstores to assist in the integration. Remember to change <app_name> with your apps actual name.
$SPLUNK_HOME/etc/apps/<app_name>/default/data/views/fim_interface.xml
<form script="fim_decorations.js, fim_interface.js, fim_modal.js" stylesheet="fim_decorations.css"> <label>File Integrity Monitoring Interface</label> <search id="actionSearch" depends="$perform_action$"> <query> | outputlookup fim_hashtable | append [ search index=logs-* sourcetype=fim checksum!="checksum" | rex field=_raw "^(?P<type>\w+)\s+(?P<checksum>[^ ]+)\s+(?P<filename>.+)" | search host IN ( "*" ) filename IN ( "*" ) | stats latest(checksum) as expected by filename host ] | outputlookup fim_hashtable </query> </search> <search id="auditSearch" depends="$perform_action$"> <query>| inputlookup fim_auditlog | append [ stats count | eval host="N/A" | eval filename="N/A" | eval expected="Performed bulk modification to hashtable" | eval username="$env:user_realname$" | eval created=now() | convert ctime(created) ] | table host, filename, expected, username, created | outputlookup fim_auditlog</query> </search> <search id="updateExpectedHashSearch" depends="$update_key_tok$, $update_host_tok$, $update_filename_tok$, $update_expected_tok$"> <query> | inputlookup fim_hashtable | eval key=_key | WHERE key="$update_key_tok$" | eval host="$update_host_tok$" | eval filename="$update_filename_tok$" | eval expected="$update_expected_tok$" | outputlookup fim_hashtable append=t </query> </search> <search id="createAuditEntrySearch" depends="$create_host_tok$, $create_filename_tok$, $create_expected_tok$"> <query> | inputlookup fim_auditlog | append [stats count | eval host="$create_host_tok$" | eval filename="$create_filename_tok$" | eval expected="$create_expected_tok$" | eval expected="Modified checksum to " + expected | eval username="$env:user_realname$" | eval created=now() | convert ctime(created) ] | table host, filename, expected, username, created | outputlookup fim_auditlog </query> </search> <fieldset submitButton="true" autoRun="true"> <input type="time" token="timeselect" searchWhenChanged="true"> <label></label> <default> <earliest>-24h@h</earliest> <latest>now</latest> </default> </input> <input type="multiselect" token="host" searchWhenChanged="true"> <label>Hostname</label> <choice value="*">ALL</choice> <default>*</default> <initialValue>*</initialValue> <fieldForLabel>host</fieldForLabel> <fieldForValue>host</fieldForValue> <search> <query>index=logs-* sourcetype=fim | stats dc by host</query> <earliest>-24h@h</earliest> <latest>now</latest> </search> <valuePrefix>"</valuePrefix> <valueSuffix>"</valueSuffix> <delimiter>,</delimiter> </input> <input type="multiselect" token="filename" searchWhenChanged="true"> <label>Filename</label> <choice value="*">ALL</choice> <default>*</default> <initialValue>*</initialValue> <valuePrefix>"</valuePrefix> <valueSuffix>"</valueSuffix> <delimiter>,</delimiter> <fieldForLabel>filename</fieldForLabel> <fieldForValue>filename</fieldForValue> <search> <query>index=logs-* sourcetype=fim host IN ( $host$) checksum!="checksum" | rex field=_raw "^(?P<type>\w+)\s+(?P<checksum>[^ ]+)\s+(?P<filename>.+)" | stats dc by filename</query> <earliest>-24h@h</earliest> <latest>now</latest> </search> </input> </fieldset> <row> <panel id="bulk_actions"> <html> <button class="btn btn-primary actionBtn" style="float:right;">Perform Bulk Rebase of Hashtable</button> </html> </panel> </row> <row> <panel> <title>Organizational Statistics</title> <single> <search> <query>index=logs-* sourcetype=fim checksum!="checksum" | rex field=_raw "^(?P<type>\w+)\s+(?P<checksum>[^ ]+)\s+(?P<filename>.+)" | stats latest(checksum) as current by filename host | lookup fim_hashtable host filename output expected | eval acknowledged=if(current!=expected,0,1) | where acknowledged=0 | stats count </query> <earliest>$timeselect.earliest$</earliest> <latest>$timeselect.latest$</latest> <sampleRatio>1</sampleRatio> </search> <option name="colorBy">value</option> <option name="colorMode">none</option> <option name="drilldown">none</option> <option name="numberPrecision">0</option> <option name="rangeColors">["0x65a637","0xd93f3c"]</option> <option name="rangeValues">[0]</option> <option name="refresh.display">progressbar</option> <option name="showSparkline">1</option> <option name="showTrendIndicator">1</option> <option name="trellis.enabled">0</option> <option name="trellis.scales.shared">1</option> <option name="trellis.size">medium</option> <option name="trendColorInterpretation">standard</option> <option name="trendDisplayMode">absolute</option> <option name="underLabel">MISMATCHED CHECKSUMS</option> <option name="unitPosition">after</option> <option name="useColors">1</option> <option name="useThousandSeparators">1</option> </single> <single> <search> <query>index=logs-* sourcetype=fim checksum!="checksum" | rex field=_raw "^(?P<type>\w+)\s+(?P<checksum>[^ ]+)\s+(?P<filename>.+)" | stats latest(checksum) as current by filename host | lookup fim_hashtable host filename output expected | eval acknowledged=if(current!=expected,0,1) | where acknowledged=0 | stats count as mismatches | eval compliant=if(mismatches>0,"Non-Compliant","Compliant") | fields compliant </query> <earliest>$timeselect.earliest$</earliest> <latest>$timeselect.latest$</latest> <sampleRatio>1</sampleRatio> </search> <option name="colorBy">value</option> <option name="colorMode">none</option> <option name="drilldown">none</option> <option name="numberPrecision">0</option> <option name="rangeColors">["0x65a637","0x6db7c6"]</option> <option name="rangeValues">[0]</option> <option name="refresh.display">progressbar</option> <option name="showSparkline">1</option> <option name="showTrendIndicator">1</option> <option name="trellis.enabled">0</option> <option name="trellis.scales.shared">1</option> <option name="trellis.size">medium</option> <option name="trendColorInterpretation">standard</option> <option name="trendDisplayMode">absolute</option> <option name="unitPosition">after</option> <option name="useColors">0</option> <option name="useThousandSeparators">1</option> <option name="underLabel">CURRENT STATUS</option> </single> <single> <search> <query>index=logs-* sourcetype=fim checksum!="checksum" | rex field=_raw "^(?P<type>\w+)\s+(?P<checksum>[^ ]+)\s+(?P<filename>.+)" | stats dc(filename)</query> <earliest>$timeselect.earliest$</earliest> <latest>$timeselect.latest$</latest> <sampleRatio>1</sampleRatio> </search> <option name="colorBy">value</option> <option name="colorMode">none</option> <option name="drilldown">none</option> <option name="numberPrecision">0</option> <option name="rangeColors">["0x65a637","0x6db7c6"]</option> <option name="rangeValues">[0]</option> <option name="refresh.display">progressbar</option> <option name="showSparkline">1</option> <option name="showTrendIndicator">1</option> <option name="trellis.enabled">0</option> <option name="trellis.scales.shared">1</option> <option name="trellis.size">medium</option> <option name="trendColorInterpretation">standard</option> <option name="trendDisplayMode">absolute</option> <option name="underLabel">FILES MONITORED</option> <option name="unitPosition">after</option> <option name="useColors">1</option> <option name="useThousandSeparators">1</option> </single> </panel> </row> <row> <panel> <title>File Checksum Status</title> <input type="dropdown" token="bool_status" searchWhenChanged="true"> <label>Status Filter:</label> <choice value="">Show All</choice> <choice value="| where status=0">Only Mismatches</choice> <default></default> </input> <table id="fim_status"> <search id="fimStatusSearch"> <query>index=logs-* sourcetype=fim checksum!="checksum" | rex field=_raw "^(?P<type>\w+)\s+(?P<checksum>[^ ]+)\s+(?P<filename>.+)" | search host IN ( $host$ ) filename IN ( $filename$ ) | stats latest(checksum) as current by filename host | join host filename [| inputlookup fim_hashtable | eval key=_key ] | eval status=if(current!=expected,0,1) $bool_status$ | eval action=if(status=1," ","Update") | table status, action, key, host, filename, expected, current | sort + status</query> <earliest>$timeselect.earliest$</earliest> <latest>$timeselect.latest$</latest> <sampleRatio>1</sampleRatio> </search> <option name="count">20</option> <option name="dataOverlayMode">none</option> <option name="drilldown">cell</option> <option name="percentagesRow">false</option> <option name="refresh.display">progressbar</option> <option name="rowNumbers">false</option> <option name="totalsRow">false</option> <option name="wrap">true</option> </table> </panel> </row> <row> <panel> <title>Compliancy Over Time</title> <chart> <search> <query>index=logs-* sourcetype=fim checksum!="checksum" | rex field=_raw "^(?P<type>\w+)\s+(?P<checksum>[^ ]+)\s+(?P<filename>.+)" | search host IN ( $host$ ) filename IN ( $filename$ ) | stats values(checksum) as current by filename host _time | join host filename [| inputlookup fim_hashtable ] | eval status=if(current!=expected,"Non-Compliant","Compliant") | timechart count by status </query> <earliest>$timeselect.earliest$</earliest> <latest>$timeselect.latest$</latest> <sampleRatio>1</sampleRatio> </search> <option name="charting.axisLabelsX.majorLabelStyle.overflowMode">ellipsisNone</option> <option name="charting.axisLabelsX.majorLabelStyle.rotation">0</option> <option name="charting.axisTitleX.visibility">visible</option> <option name="charting.axisTitleY.visibility">visible</option> <option name="charting.axisTitleY2.visibility">visible</option> <option name="charting.axisX.abbreviation">none</option> <option name="charting.axisX.scale">linear</option> <option name="charting.axisY.abbreviation">none</option> <option name="charting.axisY.scale">linear</option> <option name="charting.axisY2.abbreviation">none</option> <option name="charting.axisY2.enabled">0</option> <option name="charting.axisY2.scale">inherit</option> <option name="charting.chart">line</option> <option name="charting.chart.bubbleMaximumSize">50</option> <option name="charting.chart.bubbleMinimumSize">10</option> <option name="charting.chart.bubbleSizeBy">area</option> <option name="charting.chart.nullValueMode">gaps</option> <option name="charting.chart.showDataLabels">none</option> <option name="charting.chart.sliceCollapsingThreshold">0.01</option> <option name="charting.chart.stackMode">default</option> <option name="charting.chart.style">shiny</option> <option name="charting.drilldown">none</option> <option name="charting.layout.splitSeries">0</option> <option name="charting.layout.splitSeries.allowIndependentYRanges">0</option> <option name="charting.legend.labelStyle.overflowMode">ellipsisMiddle</option> <option name="charting.legend.mode">standard</option> <option name="charting.legend.placement">right</option> <option name="charting.lineWidth">2</option> <option name="trellis.enabled">0</option> <option name="trellis.scales.shared">1</option> <option name="trellis.size">medium</option> </chart> </panel> </row> <row> <panel> <title>FIM Modification Audit Log</title> <input type="multiselect" token="hostAudit" searchWhenChanged="true"> <label>Hostname</label> <choice value="*">ALL</choice> <default>*</default> <initialValue>*</initialValue> <fieldForLabel>host</fieldForLabel> <fieldForValue>host</fieldForValue> <search> <query>index=logs-* sourcetype=fim | stats dc by host</query> <earliest>-24h@h</earliest> <latest>now</latest> </search> <valuePrefix>"</valuePrefix> <valueSuffix>"</valueSuffix> <delimiter>,</delimiter> </input> <input type="multiselect" token="filenameAudit" searchWhenChanged="true"> <label>Filename</label> <choice value="*">ALL</choice> <default>*</default> <initialValue>*</initialValue> <valuePrefix>"</valuePrefix> <valueSuffix>"</valueSuffix> <delimiter>,</delimiter> <fieldForLabel>filename</fieldForLabel> <fieldForValue>filename</fieldForValue> <search> <query>index=logs-* sourcetype=fim host IN ( $host$) checksum!="checksum" | rex field=_raw "^(?P<type>\w+)\s+(?P<checksum>[^ ]+)\s+(?P<filename>.+)" | stats dc by filename</query> <earliest>-24h@h</earliest> <latest>now</latest> </search> </input> <input type="multiselect" token="userAudit" searchWhenChanged="true"> <label>Username</label> <choice value="*">ALL</choice> <default>*</default> <initialValue>*</initialValue> <valuePrefix>"</valuePrefix> <valueSuffix>"</valueSuffix> <delimiter>,</delimiter> <fieldForLabel>username</fieldForLabel> <fieldForValue>username</fieldForValue> <search> <query>| inputlookup fim_auditlog | search host IN ( $host$ ) | stats count by username</query> <earliest>-24h@h</earliest> <latest>now</latest> </search> </input> <table id="fim_audit_log"> <search id="fimAuditSearch"> <query>| inputlookup fim_auditlog | fields created username host filename expected | rename expected as "action performed" created as performed | sort - performed</query> <earliest>$timeselect.earliest$</earliest> <latest>$timeselect.latest$</latest> <sampleRatio>1</sampleRatio> </search> <option name="count">20</option> <option name="dataOverlayMode">none</option> <option name="drilldown">none</option> <option name="percentagesRow">false</option> <option name="refresh.display">progressbar</option> <option name="rowNumbers">false</option> <option name="totalsRow">false</option> <option name="wrap">true</option> </table> </panel> </row> </form>
I chose to use a rex function in this design instead of using a props.conf file. Notice that in the code above I’m using an index=logs-*. I was too lazy to edit all the code, so remember to replace the index name with the actual index name you created in the TA. This is all pretty self-explanatory, the only part that may be confusing is the first few searches at the top. They are the ones that have the depends=<token_name>. They are going to be used in the JS code further down the screen. They are a part of the dashboard instead of integrated into the JS to provide better support for later changes. It’s much easier to modify a search on a dashboard then modify the search in JS. Next we will create the KVStores:
$SPLUNK_HOME/etc/apps/<app_name>/default/collections.conf
[fim_hashtable]
enforceTypes = true
field.expected = string
field.host = string
field.filename = string
replicate = true

[fim_auditlog]
enforceTypes = true
field.expected = string
field.host = string
field.filename = string
field.created = string
field.username = string
replicate = true
$SPLUNK_HOME/etc/apps/<app_name>/default/transforms.conf
[fim_hashtable]
external_type = kvstore
default_match = unknown
collection = fim_hashtable
max_matches = 1
min_matches = 1
fields_list = _key,expected,host,filename

[fim_auditlog]
external_type = kvstore
default_match = unknown
collection = fim_auditlog
max_matches = 1
min_matches = 1
fields_list = _key,expected,host,filename,created,username
After the KVStores have been created we can start on the actual backend code. The first part will be controlling the KVStore within the dashboard. By default, Splunk doesn’t provide a way to update or delete the items in a KVstore, so we are using JS to integrate and refresh our dashboard panels. Here is the code. Please note that the file names and locations for the rest of these files are very important.
$SPLUNK_HOME/etc/apps/<app_name>/appserver/static/fim_interface.js
require([
    'underscore',
    'jquery',
    'splunkjs/mvc',
    'splunkjs/mvc/simplexml/ready!'
], function (_, $, mvc) {

    var tokens = mvc.Components.get('submitted');

    /* --- Search Reference --- */
    var updateSearch = mvc.Components.get('updateExpectedHashSearch');
    var createSearch = mvc.Components.get('createAuditEntrySearch');
    var fimStatusSearch = mvc.Components.get('fimStatusSearch');
    var fimAuditSearch = mvc.Components.get('fimAuditSearch');

    var fimStatusTable = mvc.Components.get('fim_status');

    /* --- Reference to the input values --- */
    var host_Val, filename_Val, expected_Val, key_Val;

    fimStatusTable.on('click', function (e) {

        e.preventDefault();
        if (e['field'] === 'action') {
            /* --- Pull values from the current table row --- */
            host_Val = e.data['row.host'];
            filename_Val = e.data['row.filename'];
            expected_Val = e.data['row.current'];
            key_Val = e.data['row.key'];

            /* --- this is an update --- */
            e.preventDefault();
            tokens.set('update_key_tok', key_Val);
            tokens.set('update_host_tok', host_Val);
            tokens.set('update_filename_tok', filename_Val);
            tokens.set('update_expected_tok', expected_Val);

            console.log("Updating Hashtable...");
            console.log("Key:" + key_Val);
            console.log("Host:" + host_Val);
            console.log("Filename:" + filename_Val);
            console.log("Expected:" + expected_Val);

            /* --- this is a new create --- */
            tokens.set('create_tok', 'true');
            tokens.set('create_host_tok', host_Val);
            tokens.set('create_filename_tok', filename_Val);
            tokens.set('create_expected_tok', expected_Val);
        }

    });

    /* --- Search Jobs --- */
    updateSearch.on('search:done', function () {

        fimStatusSearch.startSearch();
        fimAuditSearch.startSearch();

    });

    createSearch.on('search:done', function () {

        fimStatusSearch.startSearch();
        fimAuditSearch.startSearch();
    });
});
This is where we start referencing the searches at the top of the dashboard view. The JS will instantiate a token that allows the update searches to run, since they depend on the token to start. Without this dependency, Splunk would run the searches everytime the dashboard loaded. Then the JS waits for the search to complete, then reloads the panels. These are all referenced by the search id field on the dashboard.
Now we need to do a little bit of decoration before we handle the much larger issue of the asynchronous modal window. I will put the JS here, but it’s just a modified version of the one that comes with the Dashboard Visualization app from Splunk. I’ll put the CSS at the end of the page so I can get all the JS out of the way first.
$SPLUNK_HOME/etc/apps/<app_name>/appserver/static/fim_decorations.js
require([
    'underscore',
    'jquery',
    'splunkjs/mvc',
    'splunkjs/mvc/tableview',
    'splunkjs/mvc/simplexml/ready!'
], function(_, $, mvc, TableView) {
    var CustomIconRenderer = TableView.BaseCellRenderer.extend({
        canRender: function(cell) {
            return cell.field === 'status';
        },
        render: function($td, cell) {
            var status = cell.value;
            // Compute the icon base on the field value
            var icon;
            if(status > 0) {
                icon = 'check';
            } else {
                icon = 'alert-circle';
            }
            // Create the icon element and add it to the table cell
            $td.addClass('icon-inline numeric').html(_.template('<i class="icon-<%-icon%>"></i>', {
                icon: icon
            }));
        }
    });
    mvc.Components.get('fim_status').getVisualization(function(tableView){
        // Register custom cell renderer, the table will re-render automatically
        tableView.addCellRenderer(new CustomIconRenderer());
    });
});
This is the big one next. It uses a callback function that waits on the user to confirm an action before running the code. It may look like just a simple modal window, but the callback feature is really important. Since Splunk without the callback feature will just run the search without waiting. So if a user accidentally clicks the Bulk Rebase button on the dashboard it removes all the old hashes from the KVStore and redefines new ones. This could be an expensive operation depending on your environment. Here is the first JS file
$SPLUNK_HOME/etc/apps/<app_name>/appserver/static/fim_modal.js
require([
    'underscore',
    'backbone',
    'splunkjs/mvc',
    '../app/<app_name>/components/modalview',
    'splunkjs/mvc/searchmanager',
    'splunkjs/mvc/simplexml/ready!'
], function (_, Backbone, mvc, ModalView, SearchManager) {
    var auditSearch = mvc.Components.get('auditSearch');
    var actionSearch = mvc.Components.get('actionSearch');
    var tokens = mvc.Components.get('submitted');
    var fimStatusSearch = mvc.Components.get('fimStatusSearch');
    var fimAuditSearch = mvc.Components.get('fimAuditSearch');

    var fimStatusTable = mvc.Components.get('fim_status');

    $('.actionBtn').on("click", function (e) {
        e.preventDefault();
        var _title = "Confirm Bulk Action";
        var _message = "Are you sure you want to complete this action? It will remove all current information in the hashtable! This operation will take 1-2 minutes to complete.";
        //pass the value of the item we clicked on to the title variable
        var modal = new ModalView.show({
            title: _title,
            message: _message,
            callback: function (confirmed) {
                if (!confirmed) return; // early return
                tokens.set('perform_action', 'true');
                actionSearch.startSearch();
                auditSearch.startSearch();

                actionSearch.on('search:done', function () {
                    fimStatusSearch.startSearch();
                });

                auditSearch.on('search:done', function () {

                    fimAuditSearch.startSearch();
                });
            }
        });
    });
});
Like the other JS script we are setting a token and then updating the searches. However, this file includes a reference to another components file. This is because we want to create a template for how the modal window will look using backbone.js. This HTML in the template of the next file will get automatically inserted into the Splunk dashboard when the button is clicked. You will need to modify the <app_name> tag in this script to match your apps name as well.
$SPLUNK_HOME/etc/apps/<app_name>/appserver/static/components/modalview.js
define([
    'underscore',
    'backbone',
    'jquery'
], function (_, Backbone, $) {


    var modalTemplate = "<div id=\"pivotModal\" class=\"modal\">" +
        "<div class=\"modal-header\"><h3><%- title %></h3><button class=\"dtsBtn close\">Close</button></div>" +
        "<div class=\"modal-body\"><h3><%- message %></h3></div>" +
        "<div class=\"modal-footer\"><button " +
        "class=\"btn-default cancel\">Cancel</button><button " +
        "class=\"btn-primary confirm\">Confirm</button></div>" +
        "</div>" +
        "<div class=\"modal-backdrop\"></div>";

    var ModalView = Backbone.View.extend({

        template: _.template(modalTemplate),
        events: {
            'click .close': 'close',
            'click .cancel': 'close',
            'click .modal-backdrop': 'close',
            'click .confirm': 'confirm',
        },
        initialize: function (options) {
            this.options = _.extend({title: 'Are you sure?', message: 'Please confirm your action'}, options);
        },
        render: function () {
            this.$el.html(this.template(this.options));
            return this;
        },
        show: function () {
            $(document.body).append(this.render().el);
            return this;
        },
        close: function () {
            this.remove();
            var cb = this.options.callback;
            if (cb) cb(false);
        },

        confirm: function () {
            this.remove();
            var cb = this.options.callback;
            if (cb) cb(true);
        }
    }, {
        // Static function
        show: function (options) {
            return new ModalView(options).show();
        }
    });

    return ModalView;
});
Almost done. Now we just need a little bit of styling to make everything look nice.
$SPLUNK_HOME/etc/apps/<app_name>/appserver/static/fim_decorations.css
/* Custom Icons */
td.icon {
    text-align: center;
}
td.icon i {
    font-size: 25px;
    text-shadow: 1px 1px #aaa;
}
td.icon .severe {
    color: red;
}
td.icon .elevated {
    color: orangered;
}
td.icon .low {
    color: #006400;
}
/* Row Coloring */
#highlight tr td {
    background-color: #c1ffc3 !important;
}
#highlight tr.range-elevated td {
    background-color: #ffc57a !important;
}
#highlight tr.range-severe td {
    background-color: #d59392 !important;
}
#highlight .table td {
    border-top: 1px solid #fff;
}
#highlight td.range-severe, td.range-elevated {
    font-weight: bold;
}
.icon-inline i {
    font-size: 18px;
    margin-left: 5px;
}
.icon-inline i.icon-alert-circle {
    color: #ef392c;
}
.icon-inline i.icon-alert {
    color: #ff9c1a;
}
.icon-inline i.icon-check {
    color: #5fff5e;
}
Nothing fancy here. Just pulled it from the Dashboard Visualization app from Splunk. Can’t remember if I even modified it at all. And that’s it. You should now be able to view and modify a verification table of hashes and get provide audit resources.
Sorry. I know this was a long one. So if you need additional info let me know.