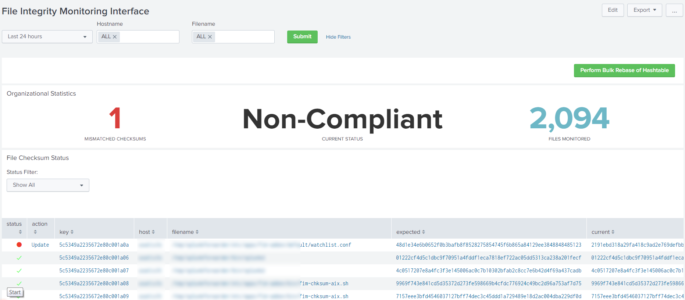
This is the code for my original reddit post at https://www.reddit.com/r/Splunk/comments/am3tgr/simple_file_integrity_monitoring/ This dashboard allows users to manage simple File Integrity Monitoring (FIM) within Splunk. Please note that this isn’t a full FIM suite as it only validates if a checksum has been changed on a file, but I have included a simple TA for Linux. However, if you […]
Searching Your Searches
Below is the raw XML of a dashboard we wrote about on our blog a couple of months ago. Click here to read that blog, or copy/paste this XML in your Splunk instance!
1 2 3 4 5 6 7 8 9 10 11 12 13 14 15 16 17 18 19 20 21 22 23 24 25 26 27 28 29 30 31 32 33 34 35 36 37 38 39 40 41 42 43 44 45 46 47 48 49 50 51 52 53 54 55 56 57 58 59 60 61 62 63 64 65 66 67 68 69 70 71 72 73 74 75 76 77 78 79 80 81 82 83 84 85 86 87 88 89 |
<form theme="dark"> <label>Searching for Searches</label> <fieldset submitButton="true"> <input type="text" token="search_input"> <label>Search for field here:</label> </input> </fieldset> <row> <panel> <title>Dashboards</title> <single> <search> <query>| rest splunk_server=local /servicesNS/-/-/data/ui/views | search eai:data="*$search_input$*" | stats count</query> <earliest>-7d@h</earliest> <latest>now</latest> </search> <option name="colorMode">block</option> <option name="drilldown">all</option> <option name="height">285</option> <option name="rangeColors">["0xdc4e41","0x53a051"]</option> <option name="rangeValues">[0]</option> <option name="refresh.display">progressbar</option> <option name="useColors">1</option> <!--Setting the token for the hidden panel--> <drilldown> <set token="peekaboo">| rest splunk_server=local /servicesNS/-/-/data/ui/views | search eai:data="*$search_input$*" | rename author AS Author eai:acl.sharing AS Permissions eai:appName AS App eai:data AS "Dashboard XML" | fields Author Permissions App "Dashboard XML"</set> </drilldown> </single> </panel> <panel> <title>Saved Searches</title> <single> <search> <query>| rest splunk_server=local /services/saved/searches | search search="*$search_input$*" | stats count</query> <earliest>-24h@h</earliest> <latest>now</latest> </search> <option name="colorMode">block</option> <option name="drilldown">all</option> <option name="height">285</option> <option name="rangeColors">["0xdc4e41","0x53a051"]</option> <option name="rangeValues">[0]</option> <option name="refresh.display">progressbar</option> <option name="useColors">1</option> <!--Setting the token for the hidden panel--> <drilldown> <set token="peekaboo">| rest splunk_server=local /services/saved/searches | search search="*$search_input$*" | rename eai:acl.owner AS Author eai:acl.sharing AS Permissions eai:acl.app AS App search AS "Saved Search" | fields Author Permissions App "Saved Search"</set> </drilldown> </single> </panel> <panel> <title>Event Types</title> <single> <search> <query>| rest splunk_server=local /servicesNS/-/-/saved/eventtypes | search search="*$search_input$*" | stats count</query> <earliest>-24h@h</earliest> <latest>now</latest> </search> <option name="colorMode">block</option> <option name="drilldown">all</option> <option name="height">285</option> <option name="rangeColors">["0xdc4e41","0x53a051"]</option> <option name="rangeValues">[0]</option> <option name="refresh.display">progressbar</option> <option name="useColors">1</option> <!--Setting the token for the hidden panel--> <drilldown> <set token="peekaboo">| rest splunk_server=local /servicesNS/-/-/saved/eventtypes | search search="*$search_input$*" | rename eai:acl.owner AS Author eai:acl.sharing AS Permissions eai:acl.app AS App search AS "Event Type" | fields Author Permissions App "Event Type"</set> </drilldown> </single> </panel> </row> <row> <!--Here is said hidden panel--> <panel depends="$peekaboo$"> <table> <search> <query>$peekaboo$</query> <earliest>-24h</earliest> <latest>now</latest> </search> <option name="drilldown">cell</option> <drilldown> <unset token="peekaboo"></unset> </drilldown> </table> </panel> </row> </form> |
High Level Windows Dashboard
Part 1 – User Logon Activity The following Splunk Dashboard provides a high level view of windows user logon activity. It should be emphasized that the focus of this dashboard is fairly high level, has a time picker (defaulting to 7 days) and shows both successful and failed user logons (table and timechart) as well […]
User Info Dashboard – Using REST
I found this very useful user statistics/information splunk dashboard on www.function1.com/2016/06/rest-easy-with-the-splunk-rest-api. They have additional Splunk REST queries and examples worth checking out!
1 2 3 4 5 6 7 8 9 10 11 12 13 14 15 16 17 18 19 20 21 22 23 24 25 26 27 28 29 30 31 32 33 34 35 36 37 38 39 40 41 42 43 44 45 46 47 48 49 50 51 52 53 54 55 56 57 58 59 60 61 62 63 64 65 66 67 68 69 70 71 72 73 74 75 76 77 78 79 80 |
<dashboard> <label>REST API: access control</label> <row> <panel> <single> <title>You are</title> <searchString>| rest /services/authentication/current-context | where NOT username="splunk-system-user" | fields username</searchString> <earliestTime>0</earliestTime> <latestTime/> <option name="drilldown">none</option> </single> </panel> <panel> <table> <title>And you have these permissions</title> <searchString>| rest /services/authentication/current-context | where NOT username="splunk-system-user" | fields capabilities | mvexpand capabilities</searchString> <earliestTime>0</earliestTime> <latestTime/> <option name="wrap">true</option> <option name="rowNumbers">false</option> <option name="dataOverlayMode">none</option> <option name="drilldown">cell</option> <option name="count">5</option> </table> </panel> </row> <row> <panel> <table> <title>Active users (sessions)</title> <searchString>| rest /services/authentication/httpauth-tokens | fields userName, timeAccessed | dedup userName sortby timeAccessed</searchString> <earliestTime>0</earliestTime> <latestTime/> <option name="wrap">true</option> <option name="rowNumbers">false</option> <option name="dataOverlayMode">none</option> <option name="drilldown">cell</option> <option name="count">10</option> </table> </panel> <panel> <table> <title>All users (limited to 100)</title> <searchString>| rest /services/authentication/users | fields title, realname | head 100</searchString> <earliestTime>0</earliestTime> <latestTime/> <option name="wrap">true</option> <option name="rowNumbers">false</option> <option name="dataOverlayMode">none</option> <option name="drilldown">cell</option> </table> </panel> <panel> <chart> <title>Users by authentication system</title> <searchString>| rest /services/authentication/users | fields title, type | stats count by type</searchString> <earliestTime>0</earliestTime> <latestTime/> <option name="charting.axisLabelsX.majorLabelStyle.overflowMode">ellipsisNone</option> <option name="charting.axisLabelsX.majorLabelStyle.rotation">0</option> <option name="charting.axisTitleX.visibility">visible</option> <option name="charting.axisTitleY.visibility">visible</option> <option name="charting.axisTitleY2.visibility">visible</option> <option name="charting.axisX.scale">linear</option> <option name="charting.axisY.scale">linear</option> <option name="charting.axisY2.enabled">false</option> <option name="charting.axisY2.scale">inherit</option> <option name="charting.chart">pie</option> <option name="charting.chart.nullValueMode">gaps</option> <option name="charting.chart.sliceCollapsingThreshold">0.01</option> <option name="charting.chart.stackMode">default</option> <option name="charting.chart.style">shiny</option> <option name="charting.drilldown">all</option> <option name="charting.layout.splitSeries">0</option> <option name="charting.legend.labelStyle.overflowMode">ellipsisMiddle</option> <option name="charting.legend.placement">right</option> </chart> </panel> </row> </dashboard> |