-
10 months, 1 week ago
Azeemering wrote a new post
Identify all saved searches that use a specific keywordDescription: This Splunk search searches all your saved searches for a specific keyword. Handy if you need […]
-
2 years, 9 months ago
Azeemering wrote a new post
Use this search to audit your correlation searches. It includes various information like who is the author of the correlation search, who modified it, etc.
In addition to that, the search also gives you an brief […] -
3 years, 7 months ago
Azeemering wrote a new post
| rest splunk_server=local /services/data/lookup-table-files/
| rename eai:acl.app as app
| table app title
| search NOT title IN (*.kmz)
| map maxsearches=990 search=”| inputlookup $title$
| eval size=0
| […] -
3 years, 7 months ago
Azeemering wrote a new post
Description
Detect if any log file in Splunk contains Credit Card numbers.
index=* ((source IN(“*.log”,”*.bak”,”*.txt”, “*.csv”,”/tmp*”,”/temp*”,”c:tmp*”)) OR (tag=web dest_content=*))
| eval comment=”Match […] -
3 years, 10 months ago
Azeemering wrote a new post
Description:
Use this Splunk search to find Base64 encoded content in DNS queries. The goal is to examine the DNS query field of the dns events to find subdomain streams that contain only Base64 valid […] -
3 years, 11 months ago
Azeemering wrote a new post
This search shows you all scheduled searches and their respective cron frequency and cron schedule. This also helps finding frequently running saved searches.
| rest splunk_server=local […] -
3 years, 11 months ago
Azeemering wrote a new post
Data model Acceleration DetailsThis Splunk Search shows you a lot of good information about your data model acceleration and performance. | rest […]
-
4 years, 3 months ago
Azeemering wrote a new post
This Splunk search is an example on how to remove unwanted values from multivalue fields using mvfilter.
| gentimes start=-1 | eval field1=”pink,fluffy,unicorns” | table field1 | makemv field1 delim=”,” | eval […] -
4 years, 3 months ago
Azeemering wrote a new post
With this spl you can check what indexes exist or if you want to search for a specific index.
List all indexes:
|rest /services/data/indexes | fields title | rename title AS index
Or check if a specific index […]
-
5 years, 4 months ago
Azeemering wrote a new post
See how well your DM searches are running.
Run this search using the Line Chart visualization:
index=_internal sourcetype=scheduler component=SavedSplunker ACCELERATE NOT skipped run_time=*
| rex […] -
5 years, 5 months ago
Azeemering wrote a new post
index=_internal sourcetype=dbx_server Starting dbx_task_server
Will return events that display a little dragon ascii art:|___/|
(, /,)
/ /
(@_^_@)/ […] -
6 years ago
Azeemering wrote a new post
This search shows all the alerts that where triggered in your splunk environment:
index=_audit action=alert_fired ss_app=* | eval ttl=expiration-now() | search ttl>0 | convert ctime(trigger_time) | table […]-
This only measures triggered alerts though, no? If you do not have an action set to trigger a “Triggered Alert”, this won’t give back correct stats.
-
I re-read the title and got the right context for it now. Ty.
-
-
-
6 years ago
Azeemering wrote a new post
Quick snippet to evaluate temperature Fahrentheit to Celsius:
| eval Temperature_Fahrenheit=Temperature_Celsius*1.8+32 -
6 years, 2 months ago
Azeemering wrote a new post
Use this search to find unused dashboards:
| rest /servicesNS/-/-/data/ui/views splunk_server=*
| search isDashboard=1
| rename eai:acl.app as app
| fields title app
| join type=left title
[| search […] -
6 years, 4 months ago
Azeemering wrote a new post
A simple method on checking if your strftime (TIME_FORMAT=) in the props.conf matches your log file timestamp format.
strftime(X,Y)
This function takes a UNIX time value, X, as the first argument and renders the […] -
6 years, 11 months ago
Azeemering wrote a new post
I use this query a lot to tune and adjust scheduling, find out what searches need attention:
index=_internal sourcetype=scheduler result_count | extract pairdelim=”,”, kvdelim=”=”, auto=f | stats avg(result_count) […] -
6 years, 11 months ago
Azeemering wrote a new post
Use a linechart with this search to show you the indexing queue sizes:
index=_internal source=*metrics.log group=queue (name=parsingqueue OR name=indexqueue OR name=typingqueue OR name=aggqueue) | timechart […]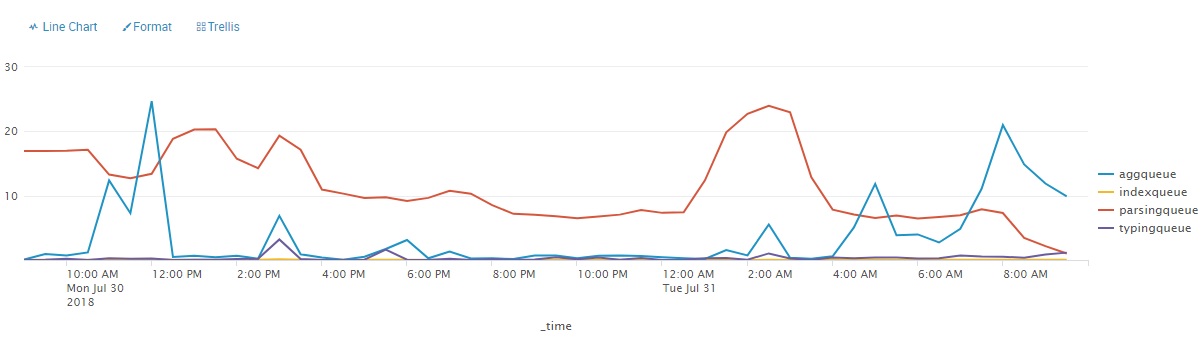
-
6 years, 11 months ago
Azeemering wrote a new post
This query will give you a table with a percentage of skipped searches and an evaluation with 3 ranges
index=_internal sourcetype=scheduler | stats count as total, count(eval(status=”skipped”)) as skipped | eval […] -
6 years, 11 months ago
Azeemering wrote a new post
This query will give you a table of all indexes and their respective retention period in days:
| rest splunk_server=* /services/data/indexes | join type=outer title [
| rest splunk_server=* […] -
6 years, 11 months ago
Azeemering wrote a new post
This search displays the amount of buckets per indexer/index
To learn more about the | dbinspect command go to:
|dbinspect index=* | search index!=_* | chart dc(bucketId) over splunk_server by index
- Load More


There’s a really GREAT app called “Proper Alerts” on splunkbase that does this and more. Helped me to balance out all of the alerts/reports running on my search heads so that I could spread out the scheduling. Plus it looks at how well formed the alerts/reports are too.