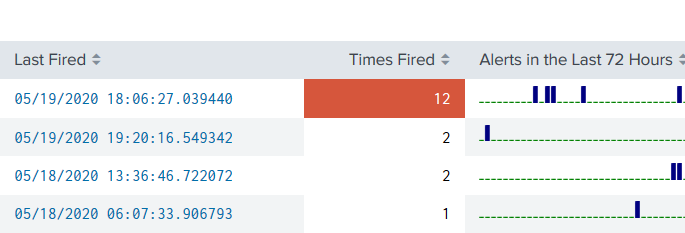
A quick dashboard panel you can plop anywhere and get a view of alerts that have recently fired, including a drilldown based on the SID of the fired alert. <row> <panel> <table> <title>Alerts Fired</title> <search> <query>index=_audit action=alert_fired |rename ss_name AS Alert |stats latest(_time) AS “Last Fired” count AS “Times Fired” sparkline AS “Alerts in the […]
List Reports and Wrap the text
|rest /servicesNS/-/-/saved/searches |table search title description alert_type “alert.expires” “alert.suppress” “alert.suppress.fields” |search alert_type=”always” |fillnull value=0 triggered_alert_count |sort “triggered_alert_count” desc |rex max_match=100 field=”search” “(?<split__regex>.{0,100}(?:\s|$)|.{100})” | rename split__regex as search
List of Alerts via REST
The following Splunk search (query) will show a list of alerts within Splunk via the | rest call: | rest /services/alerts/fired_alerts splunk_server=local| table eai:acl.owner eai:acl.app id title triggered_alert_count

