Description:
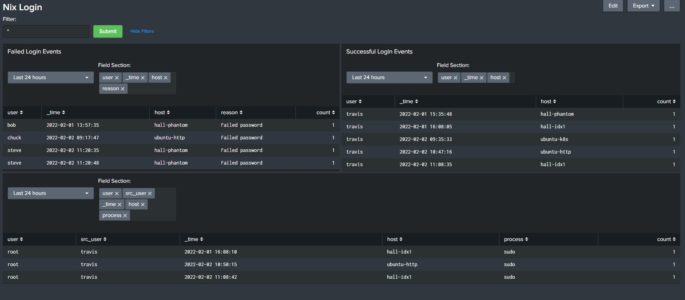
Built this dashboard to display login activity for my *nix host devices. At the top you have a box called “Filter” that allows you to insert search parameters in the base search (ex: user=thall). Each panel has it’s own “TimeRangePicker” and a “Multiselect input” which allows you to decide what fields to add to the output (by default I start with “user” except on the “Sudo Activity” where “src_user” is included).
All of *nix data goes into an index called “nix” and you will need to adjust the 3 searches that powers each panel to your environment. This dashboard has been built around field extractions that are found in the Splunk Add-on for Unix and Linux.
Tested against both Ubuntu Server and CentOS. I did run into an issue with Ubuntu server data collection where the Splunk Add-on for Unix and Linux by default does not have a “props.conf” stanza for auth.log (/var/log/auth.log). In my environment I created a “props.conf” in the local folder of the Splunk Add-on for Unix and Linux (Splunk_TA_nix) that gets deployed from my deployment-server (Folder location – $SPLUNK_HOME/etc/deployment-apps/Splunk_TA_nix/local) with the following:
[source::….auth.log]sourcetype = syslog
This allows “auth.log” to use the search time field extractions in the Splunk Add-on for Unix and Linux. If you are not using a deployment server you will need to make changes on each UF adding that “props.conf” file under $SPLUNK_HOME/etc/apps/Splunk_TA_nix/local.
Another issue I ran into was around the “app” field not allowing me to filter down on just the “ssh” value (app=ssh) without keywords like “Accepted” A workaround is to go on your Search Head or Indexer and under the local folder of Splunk_TA_nix located in $SPLUNK_HOME/etc/apps, create a file called “fields.conf” with the following:
[app]INDEXED_VALUE = false
Add-on’s required:
Splunk Add-on for Unix & Linux – https://splunkbase.splunk.com/app/833/
Dashboard:
<form theme="dark" version="1.0">
  <label>Nix Login</label>
  <fieldset submitButton="true" autoRun="false">
    <input type="text" token="filter1">
      <label>Filter:</label>
      <default>*</default>
    </input>
  </fieldset>
  <row>
    <panel>
      <title>Failed Login Events</title>
      <input type="time" token="time_fail">
        <label></label>
        <default>
          <earliest>-24h@h</earliest>
          <latest>now</latest>
        </default>
      </input>
      <input type="multiselect" token="multi_select1">
        <label>Field Section:</label>
        <choice value="_time">_time</choice>
        <choice value="host">host</choice>
        <choice value="user">user</choice>
        <choice value="process">process</choice>
        <choice value="reason">reason</choice>
        <choice value="src">src</choice>
        <choice value="src_port">src_port</choice>
        <default>user</default>
        <delimiter> </delimiter>
      </input>
      <table>
        <search>
          <query>index=nix sourcetype IN(syslog,linux_secure) app IN(sshd,ssh,login) vendor_action=Failed $filter1$
| stats count by $multi_select1$</query>
          <earliest>$time_fail.earliest$</earliest>
          <latest>$time_fail.latest$</latest>
        </search>
        <option name="drilldown">none</option>
        <option name="refresh.display">progressbar</option>
      </table>
    </panel>
    <panel>
      <title>Successful Login Events</title>
      <input type="time" token="time_succes">
        <label></label>
        <default>
          <earliest>-24h@h</earliest>
          <latest>now</latest>
        </default>
      </input>
      <input type="multiselect" token="multi_select2">
        <label>Field Section:</label>
        <choice value="_time">_time</choice>
        <choice value="host">host</choice>
        <choice value="user">user</choice>
        <choice value="process">process</choice>
        <choice value="src">src</choice>
        <choice value="src_port">src_port</choice>
        <default>user</default>
        <delimiter> </delimiter>
      </input>
      <table>
        <search>
          <query>index=nix sourcetype IN(syslog,linux_secure) app IN(sshd,ssh,login) vendor_action=Accepted $filter1$
| stats count by $multi_select2$</query>
          <earliest>$time_succes.earliest$</earliest>
          <latest>$time_succes.latest$</latest>
          <sampleRatio>1</sampleRatio>
        </search>
        <option name="count">20</option>
        <option name="dataOverlayMode">none</option>
        <option name="drilldown">none</option>
        <option name="percentagesRow">false</option>
        <option name="refresh.display">progressbar</option>
        <option name="rowNumbers">false</option>
        <option name="totalsRow">false</option>
        <option name="wrap">true</option>
      </table>
    </panel>
  </row>
  <row>
    <panel>
      <title>Sudo Activity</title>
      <input type="time" token="time_sudo">
        <label></label>
        <default>
          <earliest>-24h@h</earliest>
          <latest>now</latest>
        </default>
      </input>
      <input type="multiselect" token="multi_select3">
        <label>Field Section:</label>
        <choice value="_time">_time</choice>
        <choice value="host">host</choice>
        <choice value="user">user</choice>
        <choice value="src_user">src_user</choice>
        <choice value="process">process</choice>
        <default>user,src_user</default>
        <delimiter> </delimiter>
      </input>
      <table>
        <search>
          <query>index=nix sourcetype IN(syslog,linux_secure) app=sudo
| stats count by $multi_select3$</query>
          <earliest>$time_sudo.earliest$</earliest>
          <latest>$time_sudo.latest$</latest>
        </search>
        <option name="drilldown">none</option>
        <option name="refresh.display">progressbar</option>
      </table>
    </panel>
  </row>
</form>