
Summary CrowdStrike creates logs in JSON format and sends 2 different datasets to the same sourcetype; security events from their detection tools and audit events from their management tool. These audit tools contain analyst data about when they mark events as true positive, and withing CrowdStrike these are joined with the security event itself. To […]
Listing incident review and the closing comments
index=_audit sourcetype=”incident_review” | table rule_name comment status | rename rule_name as “Notable Event” comment as “Closing Comment” status as Status | eval Status=if(Status=5,”Closed”,if(Status=2,”In Progress”,”Not assigned”)) | dedup “Closing Comment”
Investigate by MAC, IP all VPN authentications through CISCO_ISE
Helps to investigate authentications through CISCO_ISE device. This identifies who logs in, the MAC address and IP for any use cases index=<your cisco index> “<your IP>” |rex field=”cisco_av_pair” “mdm-tlv=device-mac=(?<MAC_ID>\w+-\w+-\w+-\w+-\w+-\w+)” |rex field=”cisco_av_pair” “mdm-tlv=device-platform=(?<OS>\w+)” |rex field=_raw “(?<IP><IP regex>)” |iplocation IP |stats c sum(Acct_Input_Packets) as Packets_In sum(Acct_Output_Packets) as Packets_Out by _time User_Name Framed_Protocol src_mac City Country Region IP […]
Investigate an IP through Palo Alto Logs
index= <your palo alto index> <IP you want to investigate> |stats c sum(bytes) as Bytes_Out by _time user application action dest_ip dest_location src_ip client_ip client_location session_end_reason “app:able_to_transfer_file” “app:has_known_vulnerability” “app:prone_to_misuse” “app:used_by_malware” “app:evasive” |fields + _time user application action dest_ip dest_location client_ip client_location Bytes_Out session_end_reason “app:able_to_transfer_file” “app:has_known_vulnerability” “app:prone_to_misuse” “app:used_by_malware” “app:evasive” |rename client_ip as SourceIP |fields – user […]
List Deployment Client
index=_internal sourcetype=splunkd “deployment_client” |stats latest(_time) as LatestReportTime values(server_name) as Server_Name by host |convert ctime(LatestReportTime) |rename host as Host |fields + Host Server_Name LatestReportTime
List Reports and Wrap the text
|rest /servicesNS/-/-/saved/searches |table search title description alert_type “alert.expires” “alert.suppress” “alert.suppress.fields” |search alert_type=”always” |fillnull value=0 triggered_alert_count |sort “triggered_alert_count” desc |rex max_match=100 field=”search” “(?<split__regex>.{0,100}(?:\s|$)|.{100})” | rename split__regex as search
Timestamps from the future.
Shows all hosts that are sending events with timestamps greater than 5 mins (300 seconds) from the current time. | metadata type=hosts | where lastTime>now()+300 | eval mins_in_future=(lastTime-now())/60 | eval years_in_future=mins_in_future/60/24/365 | fieldformat lastTime=strftime(lastTime,”%Y-%m-%d %H:%M:%S %Z”) | table lastTime, host, mins_in_future, years_in_future | sort – mins_in_future
Search All Traffic by src / action – Creates Table
This is a magical query for tracking down all internal resources connecting to or from external IPs and Countries src!=10.0.0.0/8 AND src!=192.168.0.0/12 AND src!=192.168.0.0/16 action=”allowed” | iplocation src | search Country=* | table Country, src, action, bytes_out, packets_out | dedup src | sort Country
List Notable events with closing history details
`notable` | stats latest(lastTime) as LastTimeSeen values(rule_name) as “Rule Name” values(comment) as “Historical Analysis” values(user) as User by _time event_id, urgency | eval LastTimeSeen=strftime(LastTimeSeen,”%+”)
Datamodel Search Performance
See how well your DM searches are running. Run this search using the Line Chart visualization: index=_internal sourcetype=scheduler component=SavedSplunker ACCELERATE NOT skipped run_time=* | rex field=savedsearch_id “ACCELERATE_(?:[A-F0-9\-]{36}_)?(?<acceleration>.*?)_ACCELERATE” | timechart span=5m max(run_time) AS run_time by acceleration
Listing Data models
|datamodel |rex field=_raw “\”description\”:\”(?<Description>\w+|\w+\s+\w+|\w+\s+\w+\s+\w+|\w+\s+\w+\s+\w+\s+\w+\s+\w+|\w+\s+\w+\s+\w+\s+\w+\s+\w+\s+\w+|\w+\s+\w+\s+\w+\s+\w+\s+\w+\s+\w+\s+\w+)\”\,” |rex field=_raw “\”modelName\”:\”(?<DataSetName>\w+|\w+\s+\w+|\w+\s+\w+\s+\w+)\”\,” |rex field=_raw “\”parentName\”:\”(?<ParentName>\w+|\w+\s+\w+|\w+\s+\w+\s+\w+)\”\,” |rex field=_raw “\”autoextractSearch\”:(?<SearchDetails>.*\”)\,\”previewSearch.*” |table Description DataSetName SearchDetails |eval SearchDetails=replace(SearchDetails,”,\”previewSearch.*”,””) |fillnull Description value=”Description not available”
Significant Data Ingress/Egress
Generally, one expects a client-server conversation to be greater on the download side rather than more data uploaded. This search can detect greater upload than download over a time period, like a client sending significantly more data than it receives from a server (e.g. data ex-filtration). For the best search results, query on a sourcetype […]
Character Count Per Event
Here’s an incredibly simple Splunk query to count the number of characters in an event: index=* | eval CharCount=len(_raw)
Dashboard for Splunk Infrastructure/Server Specs at a Glance
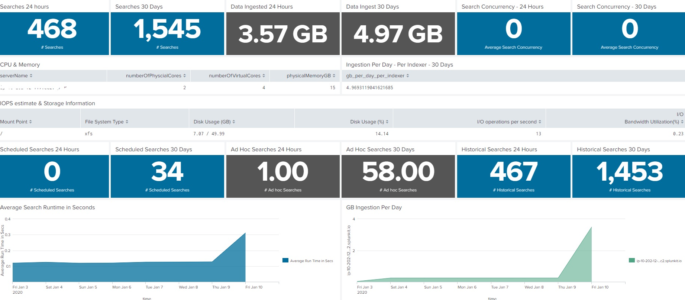
This dashboard will show the server or infrastructure specs of your Splunk environment. This is not intended to replace the Monitoring console, but rather augment as sometimes we need a condensed version of what is going on inside our Splunk environment. I’ve had fun with it on my homelab, so if you find something not […]
Detect Indexers in Maintenance Mode
This query will show any clustered indexers that are currently in maintenance mode. For it to work as an alert you will need to schedule it. It will not work if you run it in real time. sourcetype=splunkd reason=”‘Maintenance mode*” | dedup host | eval maintenance_mode_enabled=if(reason=”‘Maintenance mode started'”, “true”, “false”) | where maintenance_mode_enabled=”true” | […]
Breathing Fire Dragon when Starting dbx_task_server
index=_internal sourcetype=dbx_server Starting dbx_task_server Will return events that display a little dragon ascii art: |\___/| (,\ /,)\ / / \ (@_^_@)/ \ W//W_/ \ (//) | \ (/ /) _|_ / ) \ (// /) ‘/,_ _ _/ (~^-. (( // )) ,-{ _ `. (( /// )) ‘/\ / | (( ///)) `. { […]
Windows Dashboard showing Who (was) logged on to ?
Dashboard with 3 separate columns which allow you to drill into 3 separate assets to find out who was logged on, when they logged on, and how they logged on. Accounts for remote logins, local logins, and unlocks/reconnects accounted for but not Type 3 (network logons for shared file access etc). Time picker set so […]
Multiple Malware Detections on a Single Host
This is a simple enough query for detecting a host with multiple infections/detections. The reason for the bucket and incorporating a search over a longer time span (say 60m) is I found it to provide better results and less false negatives if the infrastructure isn’t setup to ingest data in near real-time. index=malware category=”something_high_fidelity” | […]
Baselining Dashboard
This is better and more flexible option then timewrap in my opinion. Performance ain’t too shabby either. index=foo earliest=-1d latest=now | timechart span=10m count as Current | appendcols [ search index=foo earliest=-1mon-1d latest=-mon | timechart span=10m count as “-1 Month”] | appendcols [ search index=foo earliest=-1w-1d latest=-w | timechart span=10m count as “-1 Week”]
IPS Traffic Increase
You can use this for any type of baselining alerts around a predefined standard deviation. I used the IDS data model but the same logic can be applied to any random index. |`tstats` count from datamodel=Intrusion_Detection.IDS_Attacks where IDS_Attacks.ids_type=”network” by IDS_Attacks.dest,_time span=10m | stats count by IDS_Attacks.dest,_time| eval threshold=relative_time(now(),”-10m”) | stats max(eval(if(_time>=threshold, count null()))) as latest […]
