
| rest /servicesNS/-/-/saved/searches splunk_server=local | where [|rest /services/authentication/users splunk_server=local | search roles=”admin” |fields title | rename title as author] OR author=”nobody” | rename title AS savedsearch_name, eai:acl.app as app, eai:acl.perms.write as write_roles | table author write_roles splunk_server app savedsearch_name splunk_server | mvexpand write_roles | where NOT write_roles IN(“”,”admin”) | mvcombine write_roles | eval search_name_for_link=savedsearch_name […]
Remove mulitple values from a multivalue field
This Splunk search is an example on how to remove unwanted values from multivalue fields using mvfilter. | gentimes start=-1 | eval field1=”pink,fluffy,unicorns” | table field1 | makemv field1 delim=”,” | eval field1_filtered=mvfilter(NOT match(field1,”pink”) AND NOT match(field1,”fluffy”))
List all your existing indexes or check if index exists
With this spl you can check what indexes exist or if you want to search for a specific index. List all indexes: |rest /services/data/indexes | fields title | rename title AS index Or check if a specific index exist use: |rest /services/data/indexes | fields title | rename title AS index | search index=yourindex
Deployed application status
Created this dashboard to see when or if an application was deployed successfully. Close to splunkninja’s query, this will also show if the host in question also restarted to apply the new app. <form> <label>Deployed Applications</label> <fieldset submitButton=”false”> <input type=”checkbox” token=”loglevelpicker” searchWhenChanged=”true”> <label>Log Level</label> <choice value=”INFO”>INFO</choice> <choice value=”WARN*”>WARNING</choice> <choice value=”ERROR”>ERROR</choice> <default>INFO,WARN*,ERROR</default> <valuePrefix>log_level=</valuePrefix> <delimiter> OR […]
Splunk Apps added to an instance
| rest /services/deployment/server/clients splunk_server=local | table hostname applications*.stateOnClient | untable hostname applications value | eval applications=replace(applications,”applications\.(\w+)\.stateOnClient”,”\1″) | stats values(applications) as applications by hostname
emoji bonanza
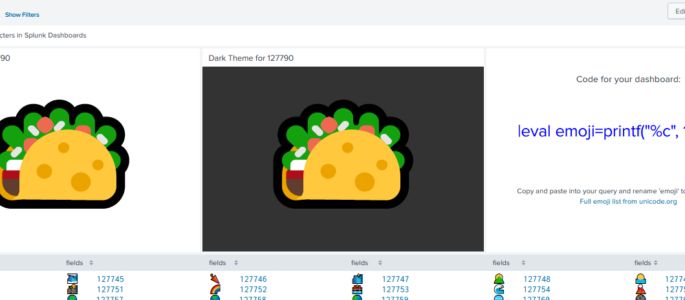
Have you ever wanted to truly express your emotions related to your search results but wasn’t sure how? Why not use an emoji? But how, you ask? Well, problem solved. Welcome to the emoji bonanza! <form theme=”light” hideFilters=”true”> <label>emoji bonanza</label> <!— Welcome to the emoji bonanza. A friend figured out how to get emoji in […]
Identifying Hosts not sending data for more than 6 hours
| tstats latest(_time) as latest where index!=”*_” earliest=-9h by host index sourcetype | eval recent = if(latest > relative_time(now(),”-360m”),”1″,”0″), LastReceiptTime = strftime(latest,”%c”) | where recent=0 | sort LastReceiptTime | eval age=now()-latest | eval age=round((age/60/60),1) | eval age=age.”hour” | fields – recent latest
Get unexpected shutdown date with downtime duration
Mainly saving you the headache of handling hidden characters which made field extraction harder than it needed to be. source=”*WinEventLog:System” EventCode=6008 “unexpected” | rex “shutdown\s+at\s+(?<time>.*)\s+on\s+[^\d]?(?<month>\d+)\/[^\d]?(?<day>\d+)\/[^\d]?(?<year>\d+)\s+was” | eval shutdownTime = strptime(year.”-“.month.”-“.day.” “.time,”%Y-%m-%d %M:%H:%S %p”) | eval downTimeDays = round((_time-shutdownTime)/86400,2) | eval shutdownTime = strftime(shutdownTime,”%c”) | table _time, host, shutdownTime, downTimeDays
Zerologon Detection (CVE-2020-1472)
Primary Search for Local Domain Controller Exploitation by Zerologon index=”<windows_index>” (sourcetype=”<windows_sourcetype_security>” OR source=”windows_source_security”) EventCode=”4742″ OR EventCode=”4624″ AND (src_user=”*anonymous*” OR member_id=”*S-1-0*”) `comment(“This looks for all 4624 and 4742 events under an ‘ANONYMOUS USER’, which are tied to the exploitation of Zerologon”)` | eval local_system=mvindex(upper(split(user,”$”)),0) `comment(“This effectively splits the user field, which when parsed with the TA […]
Splunk dashboard that displays User searches
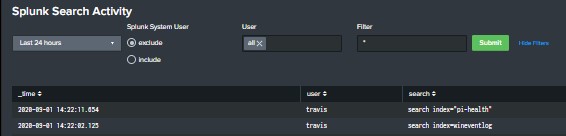
Built this dashboard to give a high level overview of user search activity. The search powering the dashboard is looking that the _audit index and you will need to ensure that you have proper access to the internal Splunk indexes. The dashboard includes a TimeRange picker, radio button to include or exclude Splunk’s system user, […]
Windows Software Matrix
Description: This query will generate a software matrix or viewing the versions and names of all software installed on windows hosts reporting to Splunk. It requires the Stanza [script://.\bin\win_installed_apps.bat] enabled in the Splunk_TA_Windows Add-on. We run this once a day and have a dashboard for viewing the data that’s hard set for the past 24 […]
ProofPoint TAP Dashboard
<form> <label>TAP Dashboard</label> <description>Direct pull from TAP API</description> <fieldset autoRun=”true” submitButton=”false”> <input type=”time” token=”time” searchWhenChanged=”true”> <label>Select Time</label> <default> <earliest>@d</earliest> <latest>now</latest> </default> </input> </fieldset> <row> <panel> <title>Quarantine Trends</title> <chart> <search> <query>sourcetype=proofpoint_tap quarantineFolder=* AND quarantineFolder!=”” | stats dc(messageID) AS distinct_message_ids by quarantineFolder | sort -distinct_message_ids</query> <earliest>$earliest$</earliest> <latest>$latest$</latest> </search> <option name=”charting.chart”>pie</option> <option name=”charting.chart.showDataLabels”>all</option> <option name=”charting.drilldown”>all</option> <option name=”charting.legend.placement”>none</option> <option […]
REST API: Table all Splunk User Email Addresses
The following simple Splunk query will put all Splunk User accounts with an email address into a panel for copy and paste purposes (such as copying all email addresses to send in an email). I’ve added a semi colon delimiter in order to literally be copy and paste into an application such as Microsoft Outlook. […]
Bucket Status Dashboard
Shows status of buckets per indexer host, when they rolled from warm to cold, and cold to frozen. Gives a timechart and table of each, as well as detailed bucket names per index & host. <form> <label>Bucket Status</label> <fieldset submitButton=”false”> <input type=”time” token=”field1″> <label></label> <default> <earliest>-24h@h</earliest> <latest>now</latest> </default> </input> <input type=”multiselect” token=”hostpicker” searchWhenChanged=”true”> <label>Which Host</label> […]
Detect Dying Sourcetypes
This alert is used for looking at a prior dataset of indexes and sourcetypes reporting over time, and then involves pairing to a closer, temporal dataset. Appending the results allows you to view sourcetypes that have stopped reporting, but existed in the prior period. | tstats count where earliest=-90d latest=-60d index=proxies_na by _time sourcetype […]
Alerts in a Panel with Drilldown
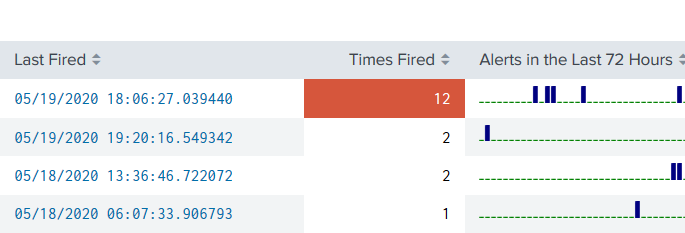
A quick dashboard panel you can plop anywhere and get a view of alerts that have recently fired, including a drilldown based on the SID of the fired alert. <row> <panel> <table> <title>Alerts Fired</title> <search> <query>index=_audit action=alert_fired |rename ss_name AS Alert |stats latest(_time) AS “Last Fired” count AS “Times Fired” sparkline AS “Alerts in the […]
Triggered Alert Analytics
Primary Dashboards Contains alert analytics for both triggered alerts and saved searches. Please replace $name$ with the saved search naming convention you utilize (ie. 0001 – AlertName). You will need an outputlookup to generate the bottom two tables; it will be based on the query that generates the second table in the dashboard. <form theme=”dark”> […]
F5 SL ASM iRule Parser for Hosted Deployments
sourcetype=f5:silverline:asm irule=* vs_ip=* | rex “(?<log>.*)” | eval log_stripped = replace(log, “\\\\”,””) | rex field=log_stripped “data=\”(?<data_section>.*?)\”, irule=” | spath input=data_section
Groundspeed Violation/Improbable Access
Oftentimes we are required to determine impossible or improbably access events. Typically, this is a relatively simple thing to do in a modern SIEM, however Splunk, without ESS, does not have a “great” way to handle this type of temporal correlation aside from appends or joins back to the original data. I constructed the following […]
F5 BigIP Brute Force and Session Abuse
Multiple Users with Authentications from Singular, non-Whitelisted IP Basically I needed a way to determine if a series of users are connecting from a singular IP. This is particular useful during COVID-19 WFH constraints. The search is intended to look at the VPN index for a new session initiation, excluding all RFC1918 traffic as a […]
