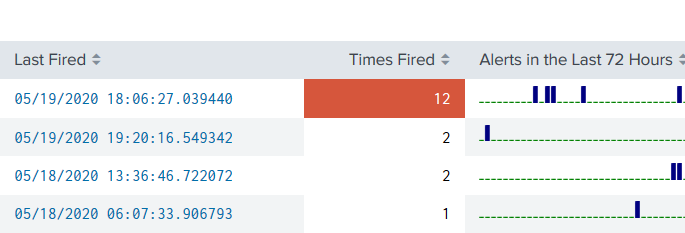
A quick dashboard panel you can plop anywhere and get a view of alerts that have recently fired, including a drilldown based on the SID of the fired alert.
<row>
<panel>
<table>
<title>Alerts Fired</title>
<search>
<query>index=_audit action=alert_fired |rename ss_name AS Alert
|stats latest(_time) AS "Last Fired" count AS "Times Fired" sparkline AS "Alerts in the Last 72 Hours"
first(sid) AS sid by Alert
|convert ctime("Last Fired")</query>
<earliest>-72h</earliest>
<latest>now</latest>
<refresh>90s</refresh>
</search>
<fields>Alert, "Last Fired", "Times Fired", "Alerts in the Last 72 Hours"</fields>
<option name="wrap">true</option>
<option name="rowNumbers">false</option>
<option name="dataOverlayMode">heatmap</option>
<option name="count">10</option>
<option name="link.inspectSearch.visible">false</option>
<option name="link.openSearch.visible">false</option>
<format field="Alerts in the Last 72 Hours" type="sparkline">
<option name="type">bar</option>
<option name="barColor">green</option>
<option name="colorMap">
<option name="1:3">navy</option>
<option name="3:7">orange</option>
<option name="8:">red</option>
</option>
</format>
<drilldown target="_blank">
<link>search?sid=$row.sid$</link>
</drilldown>
<option name="drilldown">cell</option>
</table>
<html>
<p>
Location specific instructions in html

</p>
</html>
</panel>
</row>


