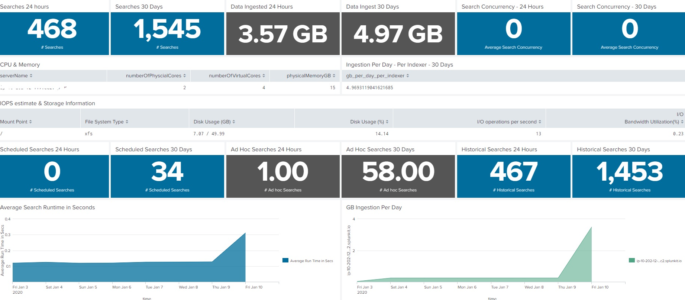
Disk Usage per Index by Indexer

Summary: Instead of grabbing data from all time, using the dbinspect command will allow administrators to quickly determine how big an index is.  There are additional fields in the dbinspect, so explore that to gain other data pivots.   |dbinspect index=_internal | stats sum(sizeOnDiskMB) by splunk_server

Continue Reading →

Searches to check search concurrency for historical or real time

The following Splunk search will output historical or real time concurrency in a timechart by host. *NOTE* Change the text <search_head> to your search heads name, alternatively use a *. index=_internal host= source=*metrics.log group=search_concurrency “system total” NOT user=* | timechart max(active_hist_searches) by host index=_internal host= source=*metrics.log group=search_concurrency “system total” NOT user=* | timechart max(active_realtime_searches) by […]

Continue Reading →

Number of Hosts Associated with a Serverclass

The following query will list the number of hosts associated with all serverclasses on your Splunk Deployment server. This query should be run on your Deployment Server. | rest /services/deployment/server/clients splunk_server=local | table hostname applications.*.serverclasses | untable hostname applications | rex field=applications “applications\.(?<apps>.+)\.serverclasses” | stats dc(hostname) as hostname by apps

Continue Reading →

Show Searches with Details (Who | When | What)

The following Splunk search will show a list of searches ran on a splunk server with the following details: Who ran the search What sourcetype was used What index was used What the search string was When the search was last ran index=_audit action=search sourcetype=audittrail search_id=* NOT (user=splunk-system-user) search!=”‘typeahead*” | rex “search\=\'(search|\s+)\s(?P<search>[\n\S\s]+?(?=\’))” | rex field=search […]

Continue Reading →

REST API response time

This is a Splunk query to measure REST API response time from the various rest URI’s in Splunk. index=_internal sourcetype=splunkd_access source=*splunkd_access.log | rex “- – – (?P<Response_Time>.*)” | rex “\”(?<REST_uri>[^\”]+)” | table _time, REST_uri, Response_Time Credit goes to somesoni2 on answers.splunk.com! Query found here: https://answers.splunk.com/answers/112073/splunk-query-to-measure-rest-api-response-time.html

Continue Reading →

Show Splunk User to Role mapping

The following Splunk REST query shows all roles, number of  capabilities, and landing app for each user. | rest /services/authentication/users | eval name=coalesce(realname, title) | stats values(roles) as Role first(defaultApp) as “Landing App” count(capabilities) as “Number of Capabilities” by name

Continue Reading →

Traffic Volume by Forwarder

This Splunk search query will show you the top 10 “chattiest” forwarders on your network. I’ve used this query to determine why some forwarders were sending more data than others. The results are displayed in kilobits, you could use an eval to change it to the appropriate size for your network. index=”_internal” source=”*metrics.lo*” group=tcpin_connections NOT […]

Continue Reading →