
Dashboard with 3 separate columns which allow you to drill into 3 separate assets to find out who was logged on, when they logged on, and how they logged on. Accounts for remote logins, local logins, and unlocks/reconnects accounted for but not Type 3 (network logons for shared file access etc). Time picker set so […]
Auditd hosts in all environments
Shows the login activity to our linux environments, sudo commands per host and users. Admin Notes: index=main was changed to index=* due to not everyone using the same index. This dashboard has been tested for code errors, but not for search errors. Please comment if you have any issues! <form> <label>Audit All Hosts</label> <fieldset submitButton=”false”> […]
Find unused dashboards
Use this search to find unused dashboards: | rest /servicesNS/-/-/data/ui/views splunk_server=* | search isDashboard=1 | rename eai:acl.app as app | fields title app | join type=left title [| search index=_internal sourcetype=splunk_web_access host=* user=* | rex field=uri_path “.*/(?<title>[^/]*)$” | stats latest(_time) as Time latest(user) as user by title ] | where isnotnull(Time) | eval Now=now() | […]
Who’s Using Splunk?
I often get asked how much a certain dashboard gets looked at, or how many times a user looks at a specific app. I wrote this quick query to answer that question. index=_internal sourcetype=”splunk_web_access” method=”GET” status=”200″ | stats count as count by user, view | appendpipe [stats sum(count) as count by user | eval view […]
Simple File Integrity Monitoring Management Dashboard
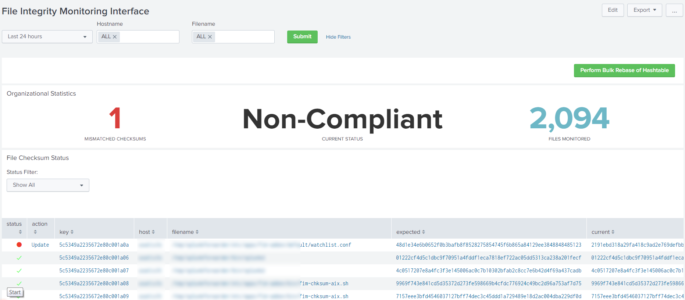
This is the code for my original reddit post at https://www.reddit.com/r/Splunk/comments/am3tgr/simple_file_integrity_monitoring/ This dashboard allows users to manage simple File Integrity Monitoring (FIM) within Splunk. Please note that this isn’t a full FIM suite as it only validates if a checksum has been changed on a file, but I have included a simple TA for Linux. However, if you […]
Concurrent Users on Apache Web
I’ve been working through this query and depending on the length of time you are looking back you can use one of the following two methods. Option 1 – Short time window (30 days or less) concurrent users for a span of 5 minutes. sourcetype=”access_combined” | timechart span=5m dc(clientip) as “Concurrent Users” Option 2 – […]
How to Check When Splunk is finished Indexing a log file
How can I tell when Splunk is finished indexing a log file? (Credit for this one goes to learnsplunk.com author who originally posted it on his website) By watching data from splunk’s metrics log in real-time. ************************************************************ index=”_internal” source=”*metrics.log” group=”per_sourcetype_thruput” series=”your_sourcetype_here” | eval MB=kb/1024 | chart sum(MB) ************************************************************ or to watch everything happening split by […]
List all ES Correlation Searches
| rest splunk_server=local count=0 /services/saved/searches | where match(‘action.correlationsearch.enabled’, “1|[Tt]|[Tt][Rr][Uu][Ee]”) | rex field=action.customsearchbuilder.spec “datamodel\\\”:\s+\\\”(?<Data_Model>\w+)” | rex field=action.customsearchbuilder.spec “object\\\”:\s+\\\”(?<Dataset>\w+)” | rename action.correlationsearch.label as Search_Name title as Rule_Name eai:acl.app as Application_Context request.ui_dispatch_app as UI_Dispatch_Context description as Description Data_Model as Guided_Mode:Data_Model Dataset as Guided_Mode:Dataset action.customsearchbuilder.enabled as Guided_Mode action.customsearchbuilder.spec as Guided_Mode:Search_Logic search as Search dispatch.earliest_time as Earliest_Time dispatch.latest_time as Latest_Time […]
Splunk License Gauge
This Splunk search query will show current license usage | rest splunk_server=local /services/licenser/pools | rename title AS Pool | search [rest splunk_server=local /services/licenser/groups | search is_active=1 | eval stack_id=stack_ids | fields stack_id] | join type=outer stack_id [rest splunk_server=local /services/licenser/stacks | eval stack_id=title | eval stack_quota=quota | fields stack_id stack_quota] | stats sum(used_bytes) as used max(stack_quota) […]
Failed Logon Attempts – Windows
The following Splunk query will show a timechart of failed logon attempts per host: source=”WinEventLog:security” EventCode=4625 | timechart span=1h count by host The following Splunk query will show a detailed table of failed logon attempts per host and user with 5 minute chunks/blocks of time, as well as show a sparkline (mini timechart) within the […]
Splunk Query Count by users
index=_audit search=* NOT (search_id=’scheduler* OR search_id=’Summary*) user=admin | timechart span=1d count by user usenull=f
Logon Types within a Windows Environment (with logon count)
This query will identify logon types within a windows environment and list the number of logons associated with each type. source=”WinEventLog:security” | eval LogonType=case(Logon_Type=”2″, “Local Console Access”, Logon_Type=”3″, “Accessing Network Folders or Files”, Logon_Type=”4″, “Scheduled Task, Batch File, or Script”, Logon_Type=”5″, “Service Account”, Logon_Type=”7″, “Local Console Unlock”, Logon_Type=”8″, “Network User Logon”, Logon_Type=”9″, “Program launched with […]
Repeated Unsuccessful Logon Attempts in Linux
The following Splunk search query will return results for failed login attempts in a Linux environment for a specified time range. The regular expressions are defined within the search string, however if you already extracted the necessary fields you can ignore the regex section. sourcetype=linux_secure | eval Date=strftime(_time, “%Y/%m/%d”) | rex “.*:\d{2}\s(?<hostname>\S+)” | rex […]
Queries Executed in DBConnect
This Splunk query will show the DBX or DBConnect queries executed. I have limited information to work with so check back for updates. Disclaimer – I’m using rex to replace HTML markup that is outputted and ingested by splunk. You may need to add to or remove this depending on your output (see query […]
Splunk CIM Assist
Got tired of having to go through each data source to determine what indexes should go into the Splunk_SA_CIM search macros, this does the leg work. index=* | fields index, tag, user, action, object_category | eval datamodel = if(tag=”alert”, index.”.”.”alert”, datamodel) | eval datamodel = if(tag=”listening” AND tag=”port”, index.”.”.”application_state_deprecated”.”.”.”endpoint”, datamodel) | eval datamodel = if(tag=”process” […]
Windows File Access Attempts
The following splunk queries will display any file access attempts (successful or failed) by user account. Ensure the Splunk App for Windows is installed grab it here: https://apps.splunk.com/app/742/ Windows 2003 and older: sourcetype=”WinEventLog:Security” EventCode=560 Object_Type=File | eval Date=strftime(_time, “%Y/%m/%d”) |eval UserName=coalesce(Primary_User_Name, Client_User_Name)| search UserName!=”*$” AND UserName!=”NETWORK SERVICE”| stats count by Date, Image_File_Name, UserName, Type, host | […]
Successful Logons – Windows
The following is a Splunk query that will display a timechart for all successful logons to windows: source=”WinEventLog:security” EventCode=4624 Logon_Type IN (2,7,10,11) NOT user IN (“DWM-*”, “UMFD-*”) | timechart span=1h count by host Here’s a detailed table showing similar information with greater detail: source=”WinEventLog:security” EventCode=4624 Logon_Type IN (2,7,10,11) NOT user IN (“DWM-*”, “UMFD-*”) | eval […]
List of Users in a Linux Environment
The following splunk query will ouput a list of user accounts appearing in linux_secure audit logs: sourcetype=linux_secure | rex “\suser[^’](?<User>\S+\w+)” | stats count by User
Apdex Score
Apdex Score Apdex is a measure of response time based against a set threshold. It measures the ratio of satisfactory response times to unsatisfactory response times. The response time is measured from an asset request to completed delivery back to the requestor. It determines user satisfaction, and is based on request type & response time. All […]
Investigate an IP through Palo Alto Logs
index= <your palo alto index> <IP you want to investigate> |stats c sum(bytes) as Bytes_Out by _time user application action dest_ip dest_location src_ip client_ip client_location session_end_reason “app:able_to_transfer_file” “app:has_known_vulnerability” “app:prone_to_misuse” “app:used_by_malware” “app:evasive” |fields + _time user application action dest_ip dest_location client_ip client_location Bytes_Out session_end_reason “app:able_to_transfer_file” “app:has_known_vulnerability” “app:prone_to_misuse” “app:used_by_malware” “app:evasive” |rename client_ip as SourceIP |fields – user […]
