
This Splunk query shows when the admin account performed Create or Modify Roles actions: index=”_audit” action=edit_roles operation=* | table _time user operation object*
Splunk Admin Account Activity – Account Modifications
This Splunk query shows when the admin account performed Account Modification / Deletion / Creation actions: index=_audit user=admin action=edit_user operation=* | table _time user operation object*
Index Modifications
This Splunk query should show which users attempted to modify an index and if that action was successful: index=_audit user=* action=indexes_edit | stats count by index info user action
Dashboard and App views by user
This Splunk query / search shows historical access to dashboards and apps on a local splunk server. index=_internal sourcetype=splunk_web_access host=* user=* | rex field=uri_path “.*/(?<title>[^/]*)$” | join title [| rest /servicesNS/-/-/data/ui/views splunk_server=* | search isDashboard=1 isVisible=1 | rename eai:acl.app as app | fields title app ] | rename title as dashboard | stats count by […]
Show how much disk space is used by _internal
The following Splunk query will return disk space used by the _internal index. index=_internal source=*license_usage.log type=Usage | eval gb=b/1024/1024/1024 | timechart span=1d sum(gb) as GB by host useother=false | untable _time host gb | top limit=1 host | join time [ search index=_internal source=*license_usage.log type=Usage | eval gb=b/1024/1024/1024 | timechart span=1d sum(gb) as GB by […]
REST API response time
This is a Splunk query to measure REST API response time from the various rest URI’s in Splunk. index=_internal sourcetype=splunkd_access source=*splunkd_access.log | rex “- – – (?P<Response_Time>.*)” | rex “\”(?<REST_uri>[^\”]+)” | table _time, REST_uri, Response_Time Credit goes to somesoni2 on answers.splunk.com! Query found here: https://answers.splunk.com/answers/112073/splunk-query-to-measure-rest-api-response-time.html
Get Sourcetype and Index Info via TSTATS
Use the following simple tstats query to return the latest time events came in for a given index as well as list all sourcetypes for each index: |tstats values(sourcetype) as Sourcetype latest(_time) as Time groupby index | convert ctime(Time)
Universal Forwarder Splunk Versions
Returns the version of Splunk Universal Forwarders in an environment via _internal logs. index=_internal sourcetype=splunkd group=tcpin_connections version=* os=* arch=* build=* hostname=* source=*metrics.log | stats latest(version) as version,latest(arch) as arch,latest(os) as os,latest(build) as build by hostname | join hostname [ | metadata type=hosts index=* | eval last_seen_hours=(now()-lastTime)/60/60 | table host, last_seen_hours | rex field=host “(?<hostname>[^\.]+)” | […]
List forwarders generating socket errors due to unkown SSL protocol
If you are using SSL on port 9997 or 9998 (or other port) to send logs from your forwarders to your indexers, you know that a misconfigured forwarder or one with incorrect certs can generate these errors. This search gives you a succinct summary of those hosts. Use Today in the timepicker. Note: Add an […]
License Usage Prediction
There is an older Splunk query here that had previously predicted license usage. I’m not sure why (perhaps the predict command has changed since the original post in 2015?), but the query is no longer working. I’ve updated the query to predict Splunk license usage using the Splunk predict command as shown below: index=_internal source=”*license_usage.lo*” […]
Saved Search Scheduler Activity
I use this query a lot to tune and adjust scheduling, find out what searches need attention: index=_internal sourcetype=scheduler result_count | extract pairdelim=”,”, kvdelim=”=”, auto=f | stats avg(result_count) min(result_count) max(result_count), sparkline avg(run_time) min(run_time) max(run_time) sum(run_time) values(host) AS hosts count AS execution_count by savedsearch_name, app | join savedsearch_name type=outer [| rest /servicesNS/-/-/saved/searches | fields title eai:acl.owner […]
Show indexing queue sizes
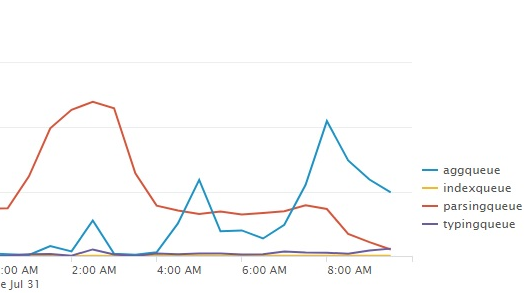
Use a linechart with this search to show you the indexing queue sizes: index=_internal source=*metrics.log group=queue (name=parsingqueue OR name=indexqueue OR name=typingqueue OR name=aggqueue) | timechart avg(current_size) by name
Percentage of skipped searches
This query will give you a table with a percentage of skipped searches and an evaluation with 3 ranges index=_internal sourcetype=scheduler | stats count as total, count(eval(status=”skipped”)) as skipped | eval pct=round(skipped/total * 100, 0) | rangemap field=pct low=0-10, elevated=10-20 severe=20-100 | eval pct = pct . “%” | fields pct, range
Show Splunk User to Role mapping
The following Splunk REST query shows all roles, number of capabilities, and landing app for each user. | rest /services/authentication/users | eval name=coalesce(realname, title) | stats values(roles) as Role first(defaultApp) as “Landing App” count(capabilities) as “Number of Capabilities” by name
Bucket Count by indexer/index
This search displays the amount of buckets per indexer/index To learn more about the | dbinspect command go to: http://docs.splunk.com/Documentation/Splunk/7.1.2/SearchReference/Dbinspect |dbinspect index=* | search index!=_* | chart dc(bucketId) over splunk_server by index
Bucket Count by State over Index
This search counts the amount of buckets per state for each index. To learn more about | dbinspect go to: http://docs.splunk.com/Documentation/Splunk/7.1.2/SearchReference/Dbinspect |dbinspect index=* | eval state=case(state==”warm” OR state==”hot”,”hot/warm”,1=1, state) | chart dc(bucketId) over index by state
Memory Usage (MB) per Splunk Process Class
Use the following search with a column chart visualisation. It will give you a good overview of what Splunk processes use the most memory: index=_introspection sourcetype=splunk_resource_usage component=PerProcess host=* | eval process = ‘data.process’ | eval args = ‘data.args’ | eval sid = ‘data.search_props.sid’ | eval elapsed = ‘data.elapsed’ | eval mem_used = ‘data.mem_used’ | eval mem […]
Universal Forwarder Throughput Limit Hit Count
This search counts the amount of times the UF’s throughput limit is hit. I also threw in a sparkline: index=_internal sourcetype=splunkd “current data throughput” | rex “Current data throughput \((?<kb>\S+)” | eval rate=case(kb < 500, “256”, kb > 499 AND kb < 520, “512”, kb > 520 AND kb < 770 ,”768″, kb>771 AND kb<1210, […]
Top 10 Accessed Dashboards
Where “host=”your_sh_host”” you could specify a host, or put a wildcard * in place. index=”_internal” source=*access.log user!=”-” */app/* (host=”your_sh_host”) | rex field=referer “/en-US/app/(?<app>[^/]+)/(?<dashboard>[^?/\s]+)” | top 10 dashboard
Universal Forwarder Throughput Statistics
This search creates a table to list all Universal Forwarders. There is also an eval in there that classifies hosts based on their average Kbps. You can modify this as needed. index=_internal source=*metrics.log group=tcpin_connections splunk_server=* | eval host=if(isnull(hostname), sourceHost,hostname) | search (host=*) AND (host!=”(ALL)”) | eval connectionType=case(fwdType==”uf”,”univ fwder”, fwdType==”lwf”, “lightwt fwder”,fwdType==”full”, “heavy fwder”, connectionType==”cooked” or […]
