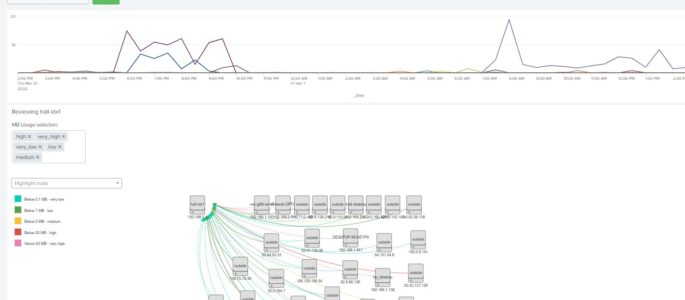
Description: Dashboard that helps me understand activity in my home lab looking at netflow data from my OPNsense firewall. This dashboard starts with a simple timechart that gives me a trend of average mb_in across all of my devices. I have OPNsense configured to send netflow data v9 to a Splunk independent stream forward which […]

