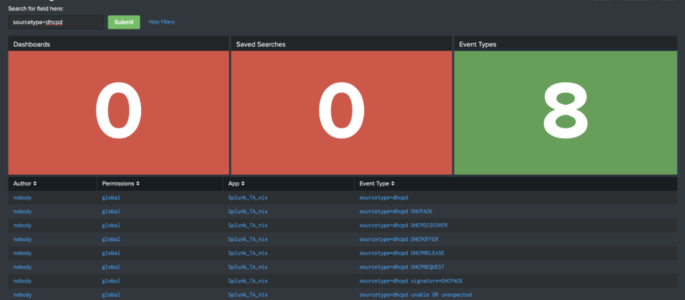
Below is the raw XML of a dashboard we wrote about on our blog a couple of months ago. Click here to read that blog, or copy/paste this XML in your Splunk instance! <form theme=”dark”> <label>Searching for Searches</label> <fieldset submitButton=”true”> <input type=”text” token=”search_input”> <label>Search for field here:</label> </input> </fieldset> <row> <panel> <title>Dashboards</title> <single> <search> <query>| […]
High Level Windows Dashboard
Part 1 – User Logon Activity The following Splunk Dashboard provides a high level view of windows user logon activity. It should be emphasized that the focus of this dashboard is fairly high level, has a time picker (defaulting to 7 days) and shows both successful and failed user logons (table and timechart) as well […]
Use TSTATS to find hosts no longer sending data
This is a simple tstats query shows all hosts and sourcetypes that have reported data, and shows the time in seconds since anything was sent. Be sure to run the query over a lengthy period of time in order to include machines that haven’t sent data for sometime. Don’t worry about the search-time so much, […]
Number of Hosts Associated with a Serverclass
The following query will list the number of hosts associated with all serverclasses on your Splunk Deployment server. This query should be run on your Deployment Server. | rest /services/deployment/server/clients splunk_server=local | table hostname applications.*.serverclasses | untable hostname applications | rex field=applications “applications\.(?<apps>.+)\.serverclasses” | stats dc(hostname) as hostname by apps
Successful Logons – Windows
The following is a Splunk query that will display a timechart for all successful logons to windows: source=”WinEventLog:security” EventCode=4624 Logon_Type IN (2,7,10,11) NOT user IN (“DWM-*”, “UMFD-*”) | timechart span=1h count by host Here’s a detailed table showing similar information with greater detail: source=”WinEventLog:security” EventCode=4624 Logon_Type IN (2,7,10,11) NOT user IN (“DWM-*”, “UMFD-*”) | eval […]
Failed Logon Attempts – Windows
The following Splunk query will show a timechart of failed logon attempts per host: source=”WinEventLog:security” EventCode=4625 | timechart span=1h count by host The following Splunk query will show a detailed table of failed logon attempts per host and user with 5 minute chunks/blocks of time, as well as show a sparkline (mini timechart) within the […]
Show Searches with Details (Who | When | What)
The following Splunk search will show a list of searches ran on a splunk server with the following details: Who ran the search What sourcetype was used What index was used What the search string was When the search was last ran index=_audit action=search sourcetype=audittrail search_id=* NOT (user=splunk-system-user) search!=”‘typeahead*” | rex “search\=\'(search|\s+)\s(?P<search>[\n\S\s]+?(?=\’))” | rex field=search […]
Forwarder TCP Connections info
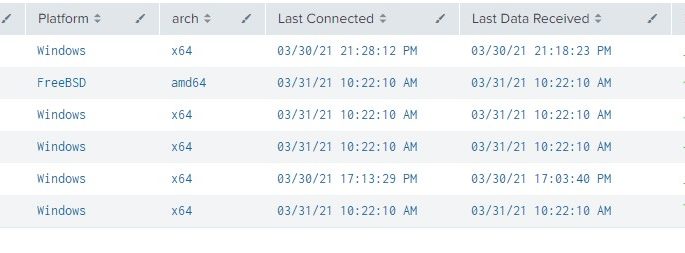
This search should help identify which forwarders are connected and give you more information on the forwarders. index=”_internal” sourcetype=”splunkd” source=”*metrics.lo*” group=tcpin_connections component=Metrics | eval sourceHost=if(isnull(hostname), sourceHost,hostname) | eval connectionType=case(fwdType==”uf”,”universal forwarder”, fwdType==”lwf”, “lightweight forwarder”,fwdType==”full”, “heavy forwarder”, connectionType==”cooked” or connectionType==”cookedSSL”,”Splunk forwarder”, connectionType==”raw” or connectionType==”rawSSL”,”legacy forwarder”) | eval version=if(isnull(version),”pre 4.2″,version) | eval guid=if(isnull(guid),sourceHost,guid) | eval os=if(isnull(os),”n/a”,os)| eval arch=if(isnull(arch),”n/a”,arch) […]
List All Splunk Users & Associated Roles
The following Splunk query will show a table of all users and their roles: | rest /services/authentication/users | stats values(roles) as Roles by user *Admin Notes* I’ve found the following query to work better in my environment: | rest /services/authentication/users | stats values(roles) as Roles by title
Splunk Admin Account Activity – Role Modifications
This Splunk query shows when the admin account performed Create or Modify Roles actions: index=”_audit” action=edit_roles operation=* | table _time user operation object*
Splunk Admin Account Activity – Account Modifications
This Splunk query shows when the admin account performed Account Modification / Deletion / Creation actions: index=_audit user=admin action=edit_user operation=* | table _time user operation object*
Index Modifications
This Splunk query should show which users attempted to modify an index and if that action was successful: index=_audit user=* action=indexes_edit | stats count by index info user action
Port usage for opsec sourcetype
Stats count by port usage index=* sourcetype=opsec | stats count by s_port proto dest dest_svc action product
Dashboard and App views by user
This Splunk query / search shows historical access to dashboards and apps on a local splunk server. index=_internal sourcetype=splunk_web_access host=* user=* | rex field=uri_path “.*/(?<title>[^/]*)$” | join title [| rest /servicesNS/-/-/data/ui/views splunk_server=* | search isDashboard=1 isVisible=1 | rename eai:acl.app as app | fields title app ] | rename title as dashboard | stats count by […]
Show how much disk space is used by _internal
The following Splunk query will return disk space used by the _internal index. index=_internal source=*license_usage.log type=Usage | eval gb=b/1024/1024/1024 | timechart span=1d sum(gb) as GB by host useother=false | untable _time host gb | top limit=1 host | join time [ search index=_internal source=*license_usage.log type=Usage | eval gb=b/1024/1024/1024 | timechart span=1d sum(gb) as GB by […]
REST API response time
This is a Splunk query to measure REST API response time from the various rest URI’s in Splunk. index=_internal sourcetype=splunkd_access source=*splunkd_access.log | rex “- – – (?P<Response_Time>.*)” | rex “\”(?<REST_uri>[^\”]+)” | table _time, REST_uri, Response_Time Credit goes to somesoni2 on answers.splunk.com! Query found here: https://answers.splunk.com/answers/112073/splunk-query-to-measure-rest-api-response-time.html
List of all enabled correlation rules that generate a notable
| rest splunk_server=local count=0 /services/saved/searches | search action.notable=”1″ is_scheduled=”1″ disabled=”0″ `comment(“PERFORM A REST COMMAND ON SAVED SEARCHES WHERE THE SEARCH GENERATES A NOTABLE, IS SCHEDULED AND IS NOT DISABLED”)` | table title action.notable.param.security_domain description search cron_schedule actions action.email.to action.notable.param.severity alert.suppress.fields alert.suppress.period action.notable.param.next_steps action.notable.param.rule_description action.risk.param._risk_score `comment(“TABLE FIELDS”)`
User Logon, Logoff, and Duration
Tweaked wenthold response to include more EventCodes. Also depending on the environment EventCode 4800|4801|4802 which is screen lock may be the closest thing to getting a log off time. > original post on splunk answers: https://answers.splunk.com/answers/597752/report-for-showing-users-logon-logoff-and-the-dura.html source=”wineventlog:security” action=success Logon_Type=2 (EventCode=4624 OR EventCode=4634 OR EventCode=4779 OR EventCode=4800 OR EventCode=4801 OR EventCode=4802 OR EventCode=4803 OR EventCode=4804 ) user!=”anonymous logon” […]
Get Sourcetype and Index Info via TSTATS
Use the following simple tstats query to return the latest time events came in for a given index as well as list all sourcetypes for each index: |tstats values(sourcetype) as Sourcetype latest(_time) as Time groupby index | convert ctime(Time)
List Deployment Apps and the associated serverClass
| rest /servicesNS/nobody/system/deployment/server/applications/ | search title =* | rename title as DeploymentApplication, serverclasses as serverClass | eval line=1 | accum line | fields line DeploymentApplication serverClass


