
ARK: Survival Evolved
Part 1
As many of you who game know, since Minecrafts debut in late 2011 indie games have taken over the gaming industry. One of their great benefits is the ability to host your own server at home or via something like AWS or another paid hosting service. This is a great feature for any number of reasons, and gamers love it!
I’m a Splunk guy, who likes to game. I recently purchased an older Dell Server to run my home Splunk instance. After throwing ESXi on it and realizing that my home logs weren’t enough interest for me I started thinking about other logs I could ingest as a fun use-case to expand my Splunk Skills, and have an excuse to host a game server. Browsing my Steam Library my choices came down to Rust or ARK: Survival Evolved. With Rust you spawn in naked (dangly bits and all), with a rock, on a radioactive island and do your best to survive. In ARK you spawn in with a loin cloth and nothing else, but you’re on an island with dinosaurs (think Jurassic Park) that you can tame and ride. Okay, clearly I decided to go with ARK.
Now before you jump all over me for hosting this on Windows, let me be clear this is hosted on Windows to maintain my quality of life. Reason being if you’re going to host an ARK server you’re going to to want to play the game, not JUST host it for others to play. Windows has this fantastic application called ARK Server Manager that makes life REALLY easy for anyone hosting an ARK server.
SPLUNK THE LOGS!
Alright, now the real reason you are here is to take your logs and make pretty pictures. First I’m going to make a few assumptions.
- You have a working Splunk Instance.
- You have a forwarder installed on your ARK Server.
- We will be referencing an index called ark and a sourcetype called ark. (Create the index if you haven’t already).
ARK logs are actually decent. They have a timestamp, followed by game detail.
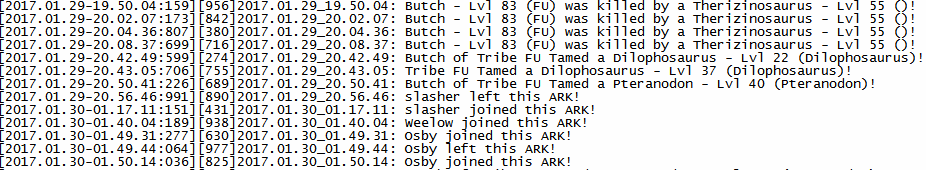
One of the initial problems when ingesting the logs was fixing the timestamp. More on this later.
Next we’ll need to configure the inputs.conf on the forwarder side. Which is really just identifying the ARK logs and putting a proper stanza in the inputs.conf. We’ll also need to ingest the perfmon logs from your Windows ARK server. Shown below is my inputs.conf, take note to the path of the last stanza and be sure to enter your proper ARK log location:
[WinEventLog://Security]
checkpointInterval = 5
current_only = 0
disabled = 0
start_from = oldest

[WinEventLog://System]
checkpointInterval = 5
current_only = 0
disabled = 0
start_from = oldest

[WinEventLog://Setup]
checkpointInterval = 5
current_only = 0
disabled = 0
start_from = oldest

[perfmon://CPU Load]
counters = % Processor Time;% User Time
instances = _Total
interval = 10
object = Processor

[perfmon://Available Memory]
counters = Available Bytes
interval = 10
object = Memory

[perfmon://Free Disk Space]
counters = Free Megabytes;% Free Space
instances = _Total
interval = 3600
object = LogicalDisk

[perfmon://Network Interface]
counters = Bytes Received/sec;Bytes Sent/sec
instances = *
interval = 10
object = Network Interface

[monitor://C:\Steam\Games\ShooterGame\Saved\Logs]
sourcetype = ark
index = ark
disabled = false
Next we’ll need to change a few things in the props.conf to extract fields properly. I’ll say here that my Regular Expressions (REGEX) are a bit off, but for the dashboard created it gets the job done. I’ll be updating later as I have time to perfect my REGEX. Additionally I noticed that the ARK server by default sets the timezone to GMT+00:00. I had to note this in the props.conf.
[ark]
TZ = GMT+00:00
EXTRACT-user = \d{2}:\s(?<user>\S+)\s\w+
EXTRACT-connectionStatus = \s(?<connectionStatus>\w+)\sthis\sARK\S
EXTRACT-tamedLvl = Tamed\sa\s(?<TamedAnimal>.+)\s-\sLvl\s(?<tamedLvl>\d+)\s\S+
EXTRACT-Murder = \d{2}:\s(?<MurderedDino>\w+)\s-\sLvl\s(?<MurderedDinoLvl>\d+).+$
Now that that is configured you can start building out your dashboard!
My top level dashboard that gives me all the information I need at a glance looks like this:
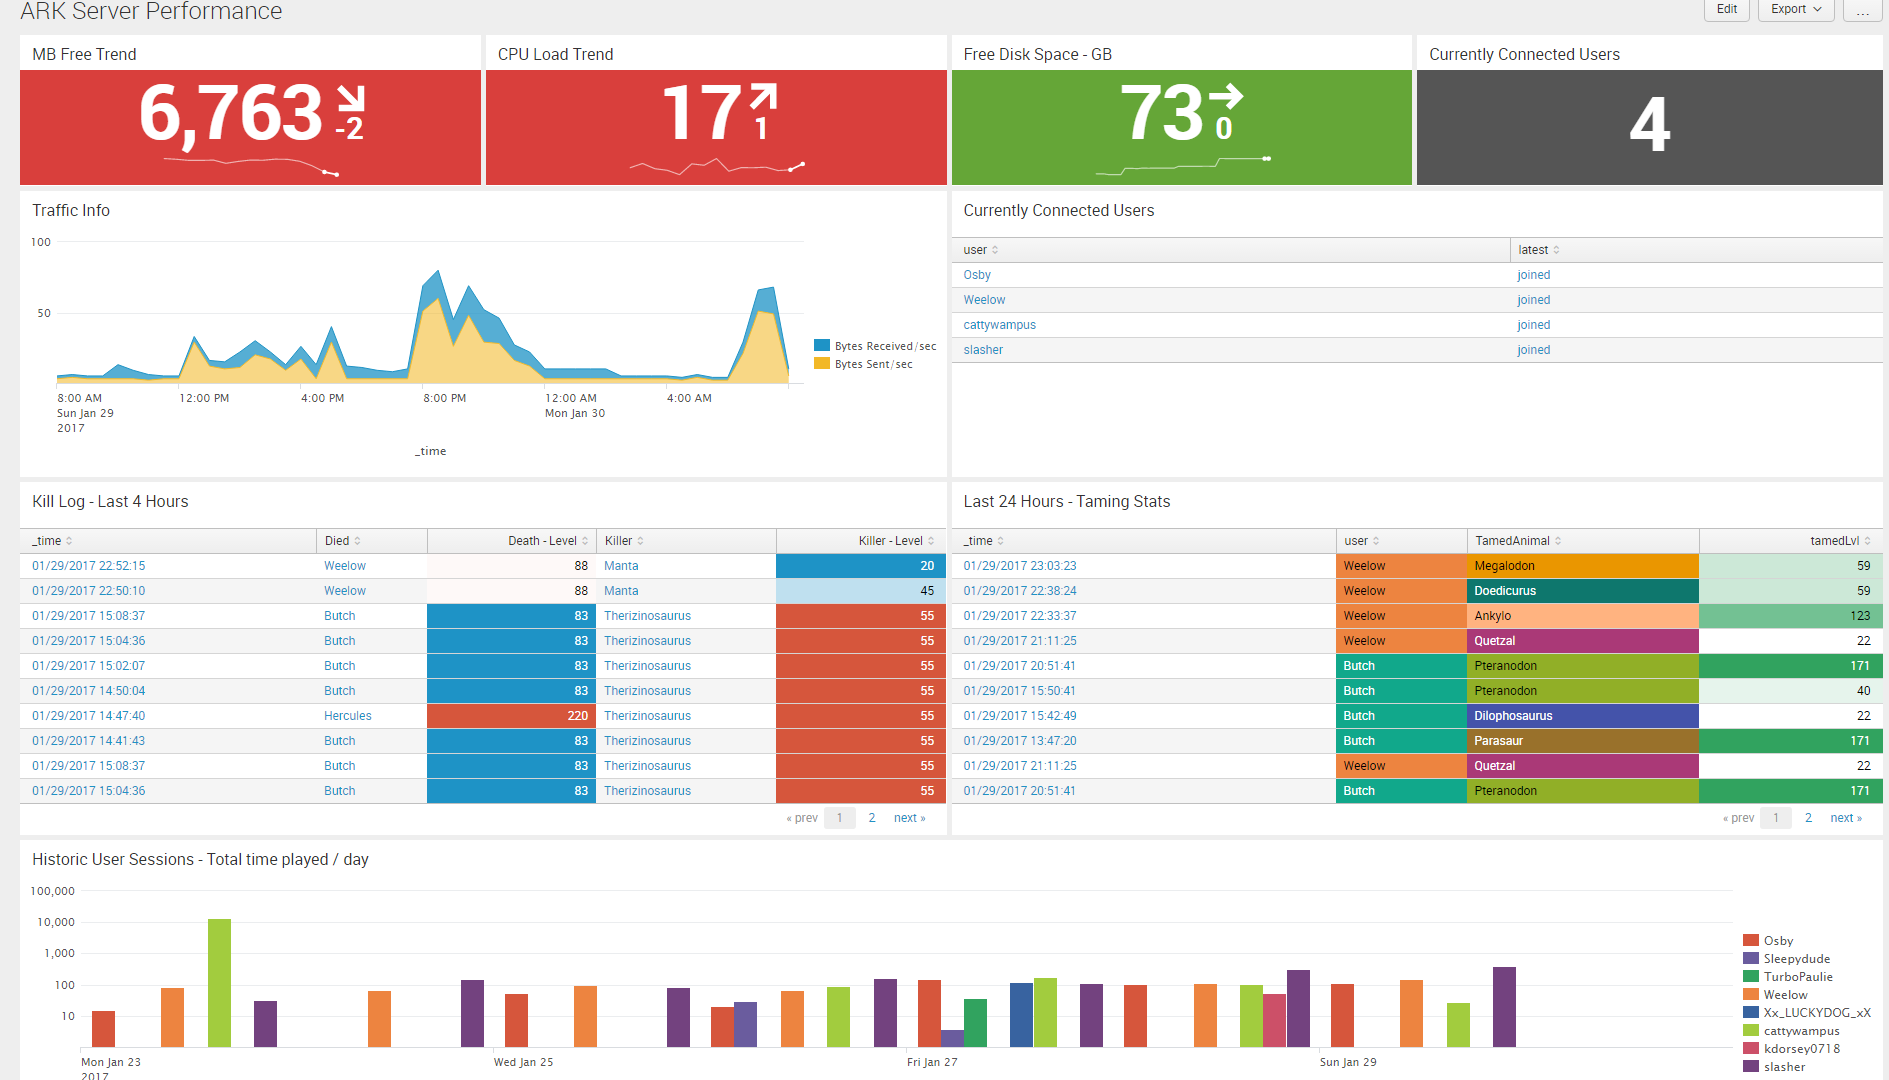
And the code:
<dashboard>
  <label>ARK Server Performance</label>
  <row>
    <panel>
      <title>MB Free Trend</title>
      <single>
        <search>
          <query>host="arkwindows"  sourcetype="Perfmon:Available Memory" | bucket _time span=1m | eval MB=round(Value/1024/1024,2)| stats avg(MB) by _time</query>
          <earliest>rt-15m</earliest>
          <latest>rtnow</latest>
          <sampleRatio>1</sampleRatio>
        </search>
        <option name="colorBy">trend</option>
        <option name="colorMode">block</option>
        <option name="drilldown">none</option>
        <option name="numberPrecision">0</option>
        <option name="rangeColors">["0xd93f3c","0xf58f39","0xf7bc38","0x65a637"]</option>
        <option name="rangeValues">[1000,2000,4000]</option>
        <option name="showSparkline">1</option>
        <option name="showTrendIndicator">1</option>
        <option name="trendColorInterpretation">standard</option>
        <option name="trendDisplayMode">absolute</option>
        <option name="unitPosition">after</option>
        <option name="useColors">1</option>
        <option name="useThousandSeparators">1</option>
      </single>
    </panel>
    <panel>
      <title>CPU Load Trend</title>
      <single>
        <search>
          <query>sourcetype="Perfmon:CPU Load" | bucket _time span=1m | stats avg(Value) by _time</query>
          <earliest>rt-15m</earliest>
          <latest>rtnow</latest>
          <sampleRatio>1</sampleRatio>
        </search>
        <option name="colorBy">trend</option>
        <option name="colorMode">block</option>
        <option name="drilldown">none</option>
        <option name="numberPrecision">0</option>
        <option name="rangeColors">["0x65a637","0xf7bc38","0xf58f39","0xd93f3c"]</option>
        <option name="rangeValues">[60,80,90]</option>
        <option name="showSparkline">1</option>
        <option name="showTrendIndicator">1</option>
        <option name="trendColorInterpretation">inverse</option>
        <option name="trendDisplayMode">absolute</option>
        <option name="unitPosition">after</option>
        <option name="useColors">1</option>
        <option name="useThousandSeparators">1</option>
      </single>
    </panel>
    <panel>
      <title>Free Disk Space - GB</title>
      <single>
        <search>
          <query>host="arkwindows" sourcetype="Perfmon:Free Disk Space" counter="Free Megabytes" |eval FreeSpace=(Value/1024)| eval GB=tostring(FreeSpace,"commas") | timechart span=4h latest(GB)</query>
          <earliest>-7d@h</earliest>
          <latest>now</latest>
          <sampleRatio>1</sampleRatio>
          <refresh>5m</refresh>
          <refreshType>delay</refreshType>
        </search>
        <option name="colorBy">value</option>
        <option name="colorMode">block</option>
        <option name="drilldown">none</option>
        <option name="numberPrecision">0</option>
        <option name="rangeColors">["0xd93f3c","0xf58f39","0xf7bc38","0x65a637"]</option>
        <option name="rangeValues">[10,20,30]</option>
        <option name="showSparkline">1</option>
        <option name="showTrendIndicator">1</option>
        <option name="trendColorInterpretation">standard</option>
        <option name="trendDisplayMode">absolute</option>
        <option name="unitPosition">after</option>
        <option name="useColors">1</option>
        <option name="useThousandSeparators">1</option>
      </single>
    </panel>
    <panel>
      <title>Currently Connected Users</title>
      <single>
        <search>
          <query>index=ark sourcetype=ark connectionStatus=* | stats latest(connectionStatus) as latest by user | where latest!="left" | stats count(user) as NumUsers</query>
          <earliest>-4h@m</earliest>
          <latest>now</latest>
          <sampleRatio>1</sampleRatio>
          <refresh>1m</refresh>
          <refreshType>delay</refreshType>
        </search>
        <option name="colorMode">block</option>
        <option name="rangeColors">["0x555","0x555"]</option>
        <option name="rangeValues">[0]</option>
        <option name="useColors">1</option>
      </single>
    </panel>
  </row>
  <row>
    <panel>
      <title>Traffic Info</title>
      <chart>
        <search>
          <query>host=ARKWindows sourcetype="Perfmon:Network Interface" | eval KB=round(Value/1024) | timechart max(KB) by counter</query>
          <earliest>-24h@h</earliest>
          <latest>now</latest>
          <sampleRatio>1</sampleRatio>
          <refresh>1m</refresh>
          <refreshType>delay</refreshType>
        </search>
        <option name="charting.axisLabelsX.majorLabelStyle.overflowMode">ellipsisNone</option>
        <option name="charting.axisLabelsX.majorLabelStyle.rotation">0</option>
        <option name="charting.axisTitleX.visibility">visible</option>
        <option name="charting.axisTitleY.visibility">visible</option>
        <option name="charting.axisTitleY2.visibility">visible</option>
        <option name="charting.axisX.scale">linear</option>
        <option name="charting.axisY.scale">linear</option>
        <option name="charting.axisY2.enabled">0</option>
        <option name="charting.axisY2.scale">inherit</option>
        <option name="charting.chart">area</option>
        <option name="charting.chart.bubbleMaximumSize">50</option>
        <option name="charting.chart.bubbleMinimumSize">10</option>
        <option name="charting.chart.bubbleSizeBy">area</option>
        <option name="charting.chart.nullValueMode">gaps</option>
        <option name="charting.chart.showDataLabels">none</option>
        <option name="charting.chart.sliceCollapsingThreshold">0.01</option>
        <option name="charting.chart.stackMode">stacked</option>
        <option name="charting.chart.style">minimal</option>
        <option name="charting.drilldown">all</option>
        <option name="charting.layout.splitSeries">0</option>
        <option name="charting.layout.splitSeries.allowIndependentYRanges">0</option>
        <option name="charting.legend.labelStyle.overflowMode">ellipsisMiddle</option>
        <option name="charting.legend.placement">right</option>
      </chart>
    </panel>
    <panel>
      <title>Currently Connected Users</title>
      <table>
        <search>
          <query>index=ark sourcetype=ark connectionStatus=* | stats latest(connectionStatus) as latest by user | where latest!="left"</query>
          <earliest>-24h@h</earliest>
          <latest>now</latest>
          <sampleRatio>1</sampleRatio>
          <refresh>1m</refresh>
          <refreshType>delay</refreshType>
        </search>
        <option name="count">20</option>
        <option name="dataOverlayMode">none</option>
        <option name="drilldown">cell</option>
        <option name="percentagesRow">false</option>
        <option name="rowNumbers">false</option>
        <option name="totalsRow">false</option>
        <option name="wrap">true</option>
      </table>
    </panel>
  </row>
  <row>
    <panel>
      <title>Kill Log - Last 4 Hours</title>
      <table>
        <search>
          <query>index=ark MurderedDino=* MurderedDinoLvl=* MurdererDino=* MurdererDinoLvl=* | table _time MurderedDino MurderedDinoLvl MurdererDino MurdererDinoLvl | convert ctime(_time) | rename MurderedDino as Died MurderedDinoLvl as "Death - Level" MurdererDino as "Killer" MurdererDinoLvl as "Killer - Level"</query>
          <earliest>-24h@h</earliest>
          <latest>now</latest>
          <sampleRatio>1</sampleRatio>
          <refresh>2m</refresh>
          <refreshType>delay</refreshType>
        </search>
        <option name="count">10</option>
        <option name="dataOverlayMode">none</option>
        <option name="drilldown">cell</option>
        <option name="percentagesRow">false</option>
        <option name="rowNumbers">false</option>
        <option name="totalsRow">false</option>
        <option name="wrap">true</option>
        <format type="color" field="MurderedDinoLvl">
          <colorPalette type="minMidMax" maxColor="#D6563C" midColor="#FFFFFF" minColor="#1E93C6"></colorPalette>
          <scale type="minMidMax" midType="percentile" midValue="50"></scale>
        </format>
        <format type="color" field="MurdererDinoLvl">
          <colorPalette type="minMidMax" maxColor="#D6563C" midColor="#FFFFFF" minColor="#1E93C6"></colorPalette>
          <scale type="minMidMax" midType="percentile" midValue="50"></scale>
        </format>
        <format type="color" field="Death - Level">
          <colorPalette type="minMidMax" maxColor="#D6563C" midColor="#FFFFFF" minColor="#1E93C6"></colorPalette>
          <scale type="minMidMax" midType="percentile" midValue="50"></scale>
        </format>
        <format type="color" field="Killer - Level">
          <colorPalette type="minMidMax" maxColor="#D6563C" midColor="#FFFFFF" minColor="#1E93C6"></colorPalette>
          <scale type="minMidMax" midType="percentile" midValue="50"></scale>
        </format>
      </table>
    </panel>
    <panel>
      <title>Last 24 Hours - Taming Stats</title>
      <table>
        <search>
          <query>index=ark TamedAnimal=* user!=Tribe | table _time user TamedAnimal tamedLvl | convert ctime(_time)</query>
          <earliest>-24h@h</earliest>
          <latest>now</latest>
          <sampleRatio>1</sampleRatio>
          <refresh>5m</refresh>
          <refreshType>delay</refreshType>
        </search>
        <option name="count">10</option>
        <option name="dataOverlayMode">none</option>
        <option name="drilldown">cell</option>
        <option name="percentagesRow">false</option>
        <option name="rowNumbers">false</option>
        <option name="totalsRow">false</option>
        <option name="wrap">true</option>
        <format type="color" field="user">
          <colorPalette type="sharedList"></colorPalette>
          <scale type="sharedCategory"></scale>
        </format>
        <format type="color" field="tamedLvl">
          <colorPalette type="minMidMax" maxColor="#31A35F" minColor="#FFFFFF"></colorPalette>
          <scale type="minMidMax"></scale>
        </format>
        <format type="color" field="TamedAnimal">
          <colorPalette type="sharedList"></colorPalette>
          <scale type="sharedCategory"></scale>
        </format>
      </table>
    </panel>
  </row>
  <row>
    <panel>
      <title>Historic User Sessions - Total time played / day</title>
      <chart>
        <search>
          <query>index=ark sourcetype=ark  | transaction user startswith=connectionStatus="joined" endswith=connectionStatus="left" |eval durationInMin=round(duration/60) | eval Date=strftime(_time, "%Y/%m/%d %H:%M:%S") | dedup Date | timechart sum(durationInMin) by user</query>
          <earliest>-7d@h</earliest>
          <latest>now</latest>
          <sampleRatio>1</sampleRatio>
          <refresh>30m</refresh>
          <refreshType>delay</refreshType>
        </search>
        <option name="charting.axisLabelsX.majorLabelStyle.overflowMode">ellipsisNone</option>
        <option name="charting.axisLabelsX.majorLabelStyle.rotation">0</option>
        <option name="charting.axisTitleX.visibility">visible</option>
        <option name="charting.axisTitleY.visibility">visible</option>
        <option name="charting.axisTitleY2.visibility">visible</option>
        <option name="charting.axisX.scale">linear</option>
        <option name="charting.axisY.scale">log</option>
        <option name="charting.axisY2.enabled">0</option>
        <option name="charting.axisY2.scale">inherit</option>
        <option name="charting.chart">column</option>
        <option name="charting.chart.bubbleMaximumSize">50</option>
        <option name="charting.chart.bubbleMinimumSize">10</option>
        <option name="charting.chart.bubbleSizeBy">area</option>
        <option name="charting.chart.nullValueMode">gaps</option>
        <option name="charting.chart.showDataLabels">none</option>
        <option name="charting.chart.sliceCollapsingThreshold">0.01</option>
        <option name="charting.chart.stackMode">default</option>
        <option name="charting.chart.style">minimal</option>
        <option name="charting.drilldown">all</option>
        <option name="charting.layout.splitSeries">0</option>
        <option name="charting.layout.splitSeries.allowIndependentYRanges">0</option>
        <option name="charting.legend.labelStyle.overflowMode">ellipsisMiddle</option>
        <option name="charting.legend.placement">right</option>
      </chart>
    </panel>
  </row>
</dashboard>
I plan to make the Splunk queries better, and of course perfect the REGEX. Feel free to borrow my code and add to it. This has been a great learning experience for me as I actually have vested interest in the logs I’m Splunking. I highly recommend something like this to anyone wanting to learn Splunk, especially if you are a gamer. Stay tuned, more to come at a future date!
-Joe
Haven’t purchased ARK: Survival Evolved yet and want to help support this site? Consider using the Following link:
