
Part 1 – User Logon Activity The following Splunk Dashboard provides a high level view of windows user logon activity. It should be emphasized that the focus of this dashboard is fairly high level, has a time picker (defaulting to 7 days) and shows both successful and failed user logons (table and timechart) as well […]
Windows Logon Dashboard
Windows dashboard to help identify users that have either failed or successfully logged in. At the top you have a box I called “Filter” that allows you to insert search parameters in the base search (ex: user=thall). Each panel has it’s own TimeRangePicker and a field selection box which allows you to decide what fields […]
Zerologon Detection (CVE-2020-1472)
Primary Search for Local Domain Controller Exploitation by Zerologon index=”<windows_index>” (sourcetype=”<windows_sourcetype_security>” OR source=”windows_source_security”) EventCode=”4742″ OR EventCode=”4624″ AND (src_user=”*anonymous*” OR member_id=”*S-1-0*”) `comment(“This looks for all 4624 and 4742 events under an ‘ANONYMOUS USER’, which are tied to the exploitation of Zerologon”)` | eval local_system=mvindex(upper(split(user,”$”)),0) `comment(“This effectively splits the user field, which when parsed with the TA […]
Dashboard sourcetype validation
Wanted a dashboard supporting checks on a sourcetype to see at the same time: how data where ingested, where and get an overview of samples and fields summary what is the stanza configuration (following the 9-step sequence) this dashboard uses internal rest API (| rest) before running dashboard a lookup table (CSV) and a lookup […]
Splunk dashboard that displays User searches
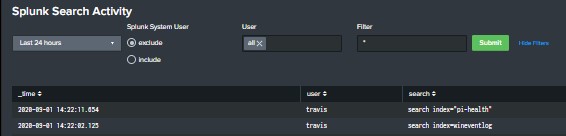
Built this dashboard to give a high level overview of user search activity. The search powering the dashboard is looking that the _audit index and you will need to ensure that you have proper access to the internal Splunk indexes. The dashboard includes a TimeRange picker, radio button to include or exclude Splunk’s system user, […]
Dashboard for Splunk Infrastructure/Server Specs at a Glance
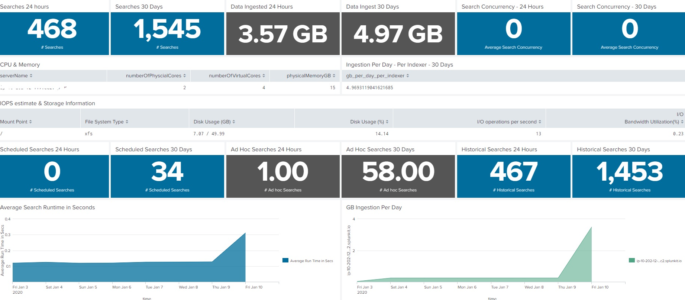
This dashboard will show the server or infrastructure specs of your Splunk environment. This is not intended to replace the Monitoring console, but rather augment as sometimes we need a condensed version of what is going on inside our Splunk environment. I’ve had fun with it on my homelab, so if you find something not […]
F5 BigIP Brute Force and Session Abuse
Multiple Users with Authentications from Singular, non-Whitelisted IP Basically I needed a way to determine if a series of users are connecting from a singular IP. This is particular useful during COVID-19 WFH constraints. The search is intended to look at the VPN index for a new session initiation, excluding all RFC1918 traffic as a […]
NIX Login Dashboard with Success, Failed and Sudo activity
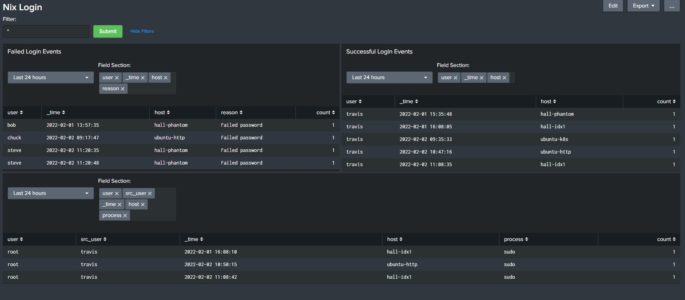
Description: Built this dashboard to display login activity for my *nix host devices. At the top you have a box called “Filter” that allows you to insert search parameters in the base search (ex: user=thall). Each panel has it’s own “TimeRangePicker” and a “Multiselect input” which allows you to decide what fields to add to […]
Splunk User Search Activity
This will return a table of users who conducted searches, the total time it took for searches to complete, a count of said searches, and the last time a search was conducted. *NOTE* You will need to modify “splunk_server=local” specifically the “local” section to represent your Splunk server. index=_audit splunk_server=local action=search (id=* OR search_id=*) | […]
Accounts Deleted via EventID’s that Correspond with Post XP/2003 Operating Systems
This query will search for accounts deleted via EventID’s that correspond with post XP/2003 operating systems. It will output the admin account, account deleted, details about the action, and the machine that the account deletion took place on. sourcetype=WinEventLog:Security (EventCode=630) |eval Date=strftime(_time, “%Y/%m/%d”)| stats count by User, Target_Account_Name, name, host, index Date | rename User […]
User Logon / Session Duration
The following query will return the duration of user logon time between initial logon and logoff events. I have a duration filter set to greater than 5 seconds to weed out any scripts that may quickly log on and log off (change this as needed to fit your environment). Windows 2008 and newer: source=WinEventLog:Security (EventCode=4624 […]
See who is using Splunk by user, app and view
########## Admin Notes This query is a modified version of one submitted by tokenwander here: https://gosplunk.com/whos-using-splunk/ ########## index=_internal sourcetype=”splunk_web_access” method=”GET” status=”200″ user!=- | stats count latest(_time) as ViewTime by user app view | sort -count | eventstats sum(count) as countByApp list(view) as view list(count) as count list(ViewTime) as ViewTime by user app | convert timeformat=”%a […]
Detailed User Activity
index=_* search=* user=* user!=- user!=splunk-system-user | rex field=search max_match=0 “index\s*=[\s\”]*(?<idx1>.*?)[\|\s\”\)]” | rex field=search max_match=0 “[\+\(|\+]index\%3D(?<idx2>.*?)[\+|\)\+]” | eval idx=if(isnull(idx1), idx2, idx1) | eval frequency=if(source=”/opt/splunk/var/log/splunk/splunkd_access.log”, “scheduled”, “ad-hoc”) | eval type=if(match(search, “summary*”), “summary”, type1) | eval idx=if(isnull(idx), “NONE”, idx) | eval end_type=if(frequency=”ad-hoc”, “ad-hoc”, type) | rename end_type as type | table _time frequency type source user idx search […]
Reports Owned by Admin Users and Writable by Others
| rest /servicesNS/-/-/saved/searches splunk_server=local | where [|rest /services/authentication/users splunk_server=local | search roles=”admin” |fields title | rename title as author] OR author=”nobody” | rename title AS savedsearch_name, eai:acl.app as app, eai:acl.perms.write as write_roles | table author write_roles splunk_server app savedsearch_name splunk_server | mvexpand write_roles | where NOT write_roles IN(“”,”admin”) | mvcombine write_roles | eval search_name_for_link=savedsearch_name […]
Splunk Admin Account Activity – Account Modifications
This Splunk query shows when the admin account performed Account Modification / Deletion / Creation actions: index=_audit user=admin action=edit_user operation=* | table _time user operation object*
User Logon, Logoff, and Duration
Tweaked wenthold response to include more EventCodes. Also depending on the environment EventCode 4800|4801|4802 which is screen lock may be the closest thing to getting a log off time. > original post on splunk answers: https://answers.splunk.com/answers/597752/report-for-showing-users-logon-logoff-and-the-dura.html source=”wineventlog:security” action=success Logon_Type=2 (EventCode=4624 OR EventCode=4634 OR EventCode=4779 OR EventCode=4800 OR EventCode=4801 OR EventCode=4802 OR EventCode=4803 OR EventCode=4804 ) user!=”anonymous logon” […]
Internal Splunk User Modifications
This query will search the internal audit sourcetype of splunk and report on any user modification attempts, both success and fail. index=_audit sourcetype=audittrail action=edit_user | eval Date=strftime(_time, “%Y/%m/%d”) |where user!=object| stats count by user, info, object, Date | rename user as “Authenticated User” | rename info as “Success Status” | rename object as “Modified Account” […]
Successful Logons to WordPress Admin Area
Ever want more detailed information on authentications to your WordPress Admin Area? This Splunk Query will show detailed information on successful authentications to the wp-admin section of your site: sourcetype=”access_combined” uri=”/wp-admin/admin-ajax.php?_fs_blog_admin=*” | iplocation clientip | stats sparkline latest(_time) as Latest_Date count(status) as count values(status) by uri, Country, Region, City, clientip | convert ctime(Latest_Date) | sort […]
Show Splunk User to Role mapping
The following Splunk REST query shows all roles, number of capabilities, and landing app for each user. | rest /services/authentication/users | eval name=coalesce(realname, title) | stats values(roles) as Role first(defaultApp) as “Landing App” count(capabilities) as “Number of Capabilities” by name
Search Common EventCodes (EventID’s) for Suspicious Behavior
This query searches many common EventCodes (EventID’s) within a Windows environment for suspicious behavior. The query can take some time to run due to it’s length. Excellent for high-level security insight. source=”wineventlog:security” user!=”DWM-*” user!=”UMFD-*” user!=SYSTEM user!=”LOCAL SERVICE” user!=”NETWORK SERVICE” user!=”*$” user!=”ANONYMOUS LOGON” user!=”IUSR” | eval Trigger=case(EventCode=516, “Audit Logs Modified”,EventCode=517, “Audit Logs Modified”,EventCode=612, “Audit Logs Modified”,EventCode=623, […]
